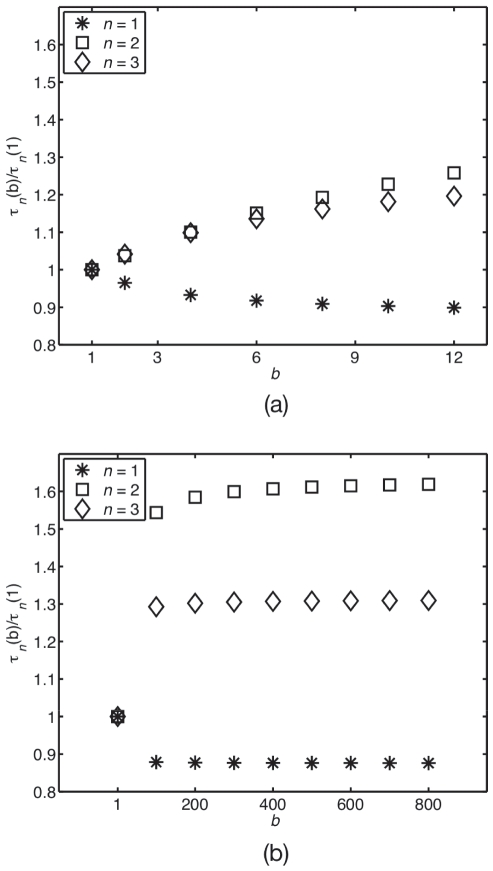
Figure 1. Lifetime from the linear noise Fokker–Planck approximation at low confinement.
Lifetime (correlation time) as a function of burst for (a) small and (b) large bursts, normalised to the no-burst, unit-stoichiometry case  for monomers
  , dimers
  and trimers
  . The region above ca.
  defines the high-
 region, where lifetimes become insentitive to
  . Note that the lifetime of monomer decreases whereas that of the dimer and trimer increases.

