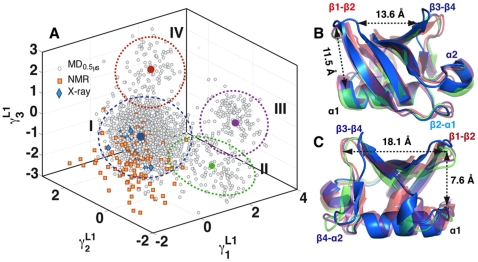
Figure 4. Quasi-anharmonic analysis (QAA) of ubiquitin conformational landscape.
(A) The MD ensemble projected onto the top three anharmonic modes of motion. The anharmonic modes are represented by  ,
,  and
and  . Level 1 (L1) indicates the level of the hierarchy. The projection (units Å) shows four distinct clusters (I-IV). The clusters were identified using a mixture of Gaussian (MoG) [41] model, with boundaries marked by ellipses drawn 3 standard deviations (
 ) from the respective cluster centers. The cluster centers are shown in blue (7,880 conformers; I) green (773; II), purple (692; III) and red (655; IV). The X-ray ensemble consisting of 44 crystal structures is shown as blue diamonds; 42 of these structures are covered within 2
 of cluster I. The
  s time-scale NMR ensemble [11] consisting of 116 conformers are shown as orange squares; 78 conformers lie with 3
 deviations from cluster I, indicating that the MD sampling has visited most bound/unbound conformations in the space spanned by
  ,
,  and
and  . (B and C). Two different view-points (rotated around y-axis by 180°) of the mean conformations from each cluster (bold circles in A) show significant structural deviations in R1 and R2. The distance between centroids of R1 and R2 are shown here for reference. In cluster I, the average distance between R1 is only 13.6 Å where as in the other three clusters (II, III and IV), the distance is 18.1 Å. The distance between R1 and R2 is maximum in cluster I (11.5 Å), where as decreases to about 7.5 Å in clusters II, III and IV.

