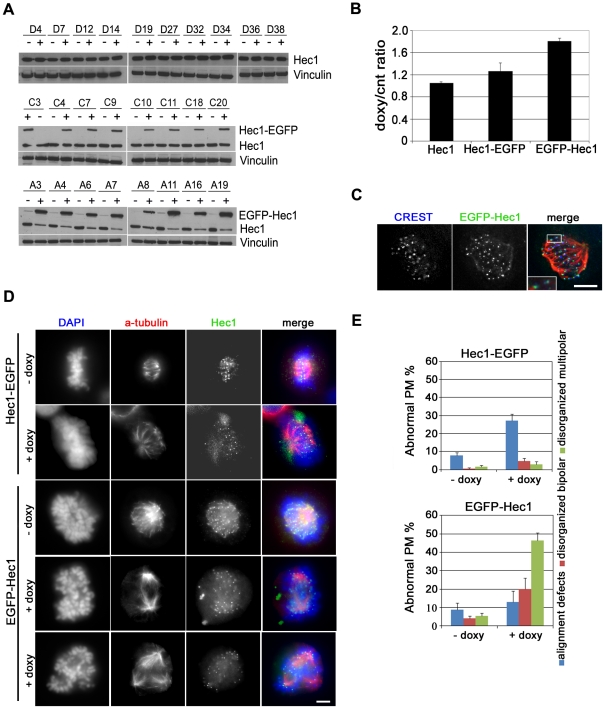
Figure 1. Inducible Hec1 expression in HeLa clones.
(A) Western blot analysis using an Hec1 antibody before (-) and after (+) doxycycline addition in HeLa clones expressing Hec1 (D clones), Hec1-EGFP (C clones) or EGFP-Hec1 (A clones). (B) Densitometric analysis of Hec1 expression in the different clones as measured by the ratio of total Hec1 (endogenous + exogenous) in induced (doxy) vs uninduced (cnt) conditions after normalization for vinculin expression. Data are mean ± SE of the ratios obtained in clones expressing untagged Hec1 (n = 10), Hec1-EGFP (n = 8) or EGFP-Hec1 (n = 8). (C) EGFP-Hec1 (green) localization after doxy induction in a prometaphase cell stained for CREST (blue) and tubulin (red). The boxed 2-fold enlargement shows EGFP-Hec1 localization with respect to the inner kinetochore marker CREST. Bar, 5 µm. (D) Chromosome congression and spindle organization before (-doxy) and after (+doxy) induction of Hec1-EGFP or EGFP-Hec1 expression as shown by α-tubulin (red) and DAPI (blue) staining. In uninduced samples Hec1 is visualized by antibody staining (green). Hec1-EGFP/-doxy: normal metaphase; Hec1-EGFP/+doxy: late prometaphase with unaligned chromosomes; EGFP-Hec1/-doxy: normal prometaphase; EGFP-Hec1/+doxy (fourth row): disorganized bipolar prometaphase; EGFP-Hec1/+doxy (last row): disorganized multipolar prometaphase. Bar, 5 µm. (E) Quantitative analysis of prometaphase abnormalities in Hec1-EGFP or EGFP-Hec1 expressing clones. Data are mean ± SE of 300 prometaphases (PM) for each condition in three independent experiments. Alignment defects were significantly higher in Hec1-EGFP expressing mitoses than in uninduced cells (P<0.01, t-test); disorganized bipolar prometaphases (P<0.05, t-test) and disorganized multipolar prometaphases (P<0.01, t-test) were significantly higher in EGFP-Hec1 expressing mitoses than in uninduced mitoses.

