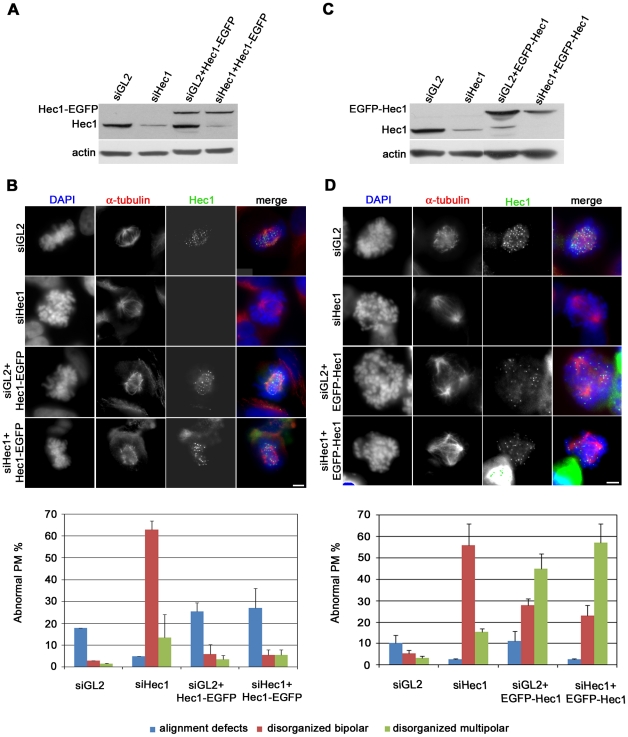
Figure 2. Expression of EGFP-Hec1 does not rescue the mitotic phenotypes induced by Hec1 depletion.
(A) Western blot analysis of Hec1 depletion with or without induced Hec1-EGFP expression. (B) Chromosome congression and spindle organization after α-tubulin (red) and DAPI staining (blue) in control (siGL2) or Hec1 silenced (siHec1) mitoses or mitoses expressing Hec1-EGFP after control silencing (siGL2+ Hec1-EGFP) or after Hec1 silencing (siHec1+ Hec1-EGFP). In siGL2 and siHec1 samples, Hec1 is visualized by antibody staining. The graph reports the frequencies of prometaphase abnormalities in the different conditions in Hec1-EGFP cells. Data are mean ± SE of 200 PM scored for each condition in two independent experiments. (C) Western blot analysis of Hec1 depletion with or without induced EGFP-Hec1 expression. (D) Chromosome congression and spindle organization after α-tubulin (red) and DAPI staining (blue) in control (GL2) or Hec1 silenced (siHec1) mitoses or mitoses expressing EGFP-Hec1 after control silencing (siGL2+ EGFP-Hec1) or after Hec1 silencing (siHec1+ EGFP-Hec1). In siGL2 and siHec1 samples, Hec1 is visualized by antibody staining. The graph reports the frequencies of prometaphase abnormalities in the different conditions in EGFP-Hec1 cells. Data are mean ± SE of 200-300 PM for each condition in two-four experiments. Disorganized bipolar prometaphases were significantly induced by siHec1 in both clones (P<0.01, t-test) and disorganized multipolar prometaphases were significantly induced after siHec1 in EGFP-Hec1 cells (P<0.05, t-test).

