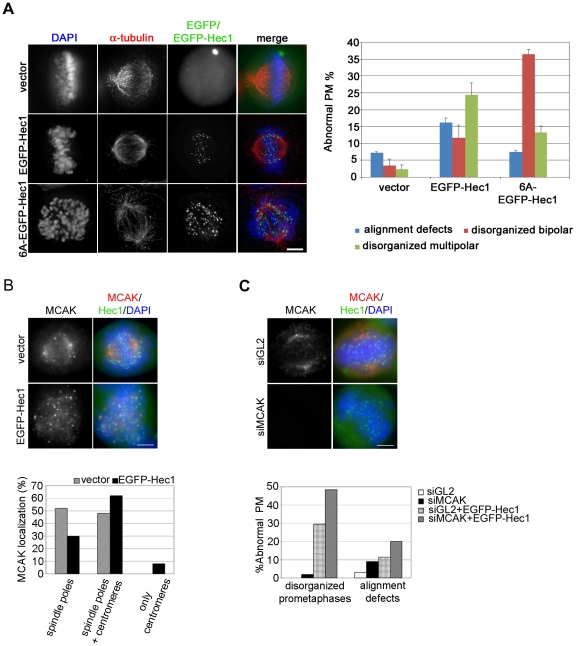
Figure 6. EGFP-Hec1 misattachments allow a partial MT dynamics at kinetochore.
(A) EGFP, EGFP-Hec1 or 6A-EGFP-Hec1 (green) expressing cells stained for α-tubulin (red) and DAPI (blue). The vast majority of chromosomes were unaligned in the 6A-EGFP-Hec1 prometaphase. The graph shows a quantitative analysis of prometaphase abnormalities in EGFP (vector), EGFP-Hec1 or 6A-EGFP-Hec1 expressing cells. (B) EGFP and EGFP-Hec1 cells were stained with antibodies to MCAK (red) and Hec1 (only for vector, green), DNA in blue. MCAK accumulated on several centromeres in the EGFP-Hec1 prometaphase. The graph shows a quantitative analysis of MACK localization in mitotic cells (n = 50). (C) MCAK (red) staining after control (GL2)- or MCAK-siRNA transfection in EGFP-Hec1 (green) cells. MCAK was efficiently depleted in the EGFP-Hec1 cell. The graph shows the percentage of abnormal phenotypes in GL2- or MCAK-silenced prometaphase/metaphase (PM/M) cells (n≥100) with or without EGFP-Hec1 expression, as scored by MCAK and DAPI staining; Both alignment defects (P<0.05, χ2 test) and disorganized prometaphases (P<0.01, χ2 test) were higher in MCAK-siRNA/EGFP-Hec1 than in GL2-siRNA/EGFP-Hec1 cells. Bars, 5 µm.

