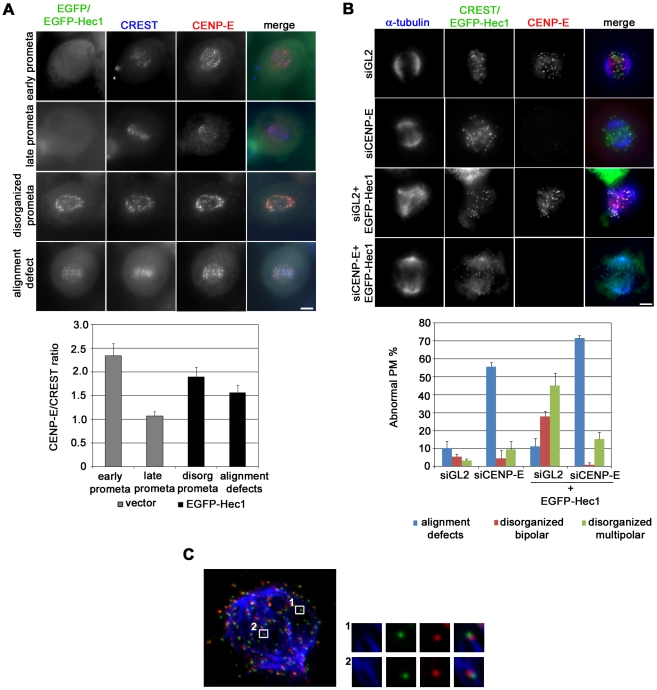
Figure 7. CENP-E function is implicated in centrosomal fragmentation.
(A) Kinetochore accumulation of CENP-E (red) in an early and a late normal prometaphase from vector transfected cultures and in a disorganized prometaphase and a late prometaphase with alignment defects from EGFP-Hec1 (green) trasfected cultures. Kinetochores are marked by CREST staining (blue). The graph shows a quantitative analysis of CENP-E intensity at kinetochores, in vector and EGFP-Hec1 transfected cells. CENP-E/CREST ratio was significantly higher in disorganized prometaphases (P<0.01, t-test) and in prometaphases with alignment defects (P<0.05) from EGFP-Hec1 expressing cells than in normal late prometaphases from vector transfected cells. (B) Chromosome congression and spindle organization in control (siGL2) or CENP-E silenced (siCENP-E) mitoses or mitoses expressing EGFP-Hec1 after control silencing (siGL2+ EGFP-Hec1) or CENP-E silencing (siCENP-E + EGFP-Hec1). Mitoses were observed after α-tubulin (blue) and CENP-E (red) staining. Kinetochores were identified by CREST staining in siGL2 and siCENP-E samples or by EGFP expression in induced samples (green). The graph shows the frequencies of abnormal PM in the different conditions. Data are mean ± SE of >150 PM scored for each condition in two experiments. Bars, 5 µm. (C) KT-MT attachments in an EGFP-Hec1 (green) expressing disorganized bipolar prometaphase exposed to MG132 for 2 h and stained for CENP-E (red) and α-tubulin (blue) after calcium buffer treatment. A maximum projection from deconvolved z-stacks is shown. Insets show a 3-fold enlargement of one optical slice from the boxed regions. An end-on attachment (inset 1) and a side-on attachment (inset 2) are shown.

