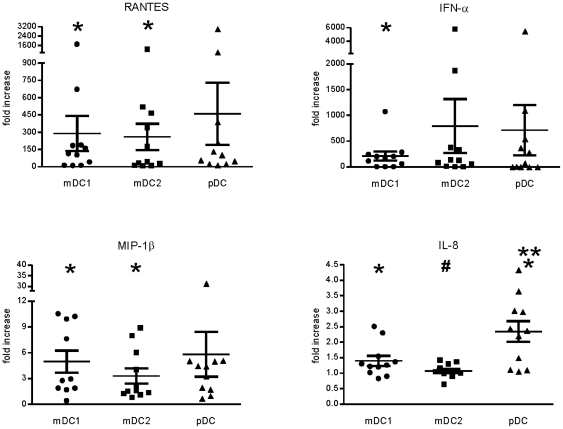
Figure 5. Cytokine and chemokine production as measured by standard sandwich ELISA.
DC subsets were isolated and exposed to RSV as described in Figure 1. Twenty-four hours after RSV infection, the culture supernatants were removed and frozen. Subsequently, cytokine and chemokine levels were measured by sandwich ELISA according to kit protocols. Data represent production levels of RSV-exposed DCs normalized to uninfected DCs of the same cell type. Actual (non-normalized) cytokine concentrations for each donor are detailed in Table S3. N = 11 with 1 donor present for 2 separate visits. * = significantly different from mock-infected cells of the same type; ** = significantly different from mDC1 and mDC2; # = significantly different from mDC1 only. p<0.05.

