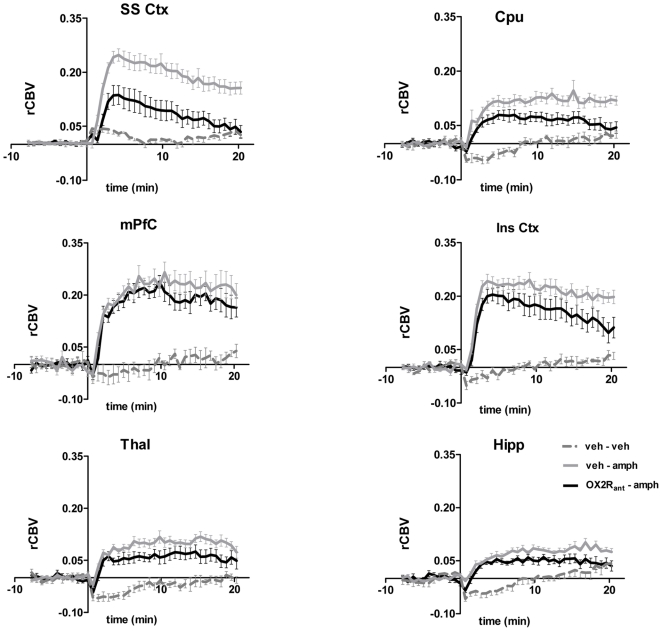
Figure 4. fMRI timecourse in representative brain regions: effect of OX2R antagonism.
Temporal-profile of amphetamine-induced rCBV changes in representative VOIs. Data are plotted as mean±SEM within each group. OX2Rant:: JNJ10397049 (50 mg/kg i.p.) [SS Ctx: somatosensory cortex; Cpu: caudate putamen; mPFC: medial prefrontal cortex; Ins Ctx; insular cortex; Thal; thalamus; Hipp: hippocampus].

