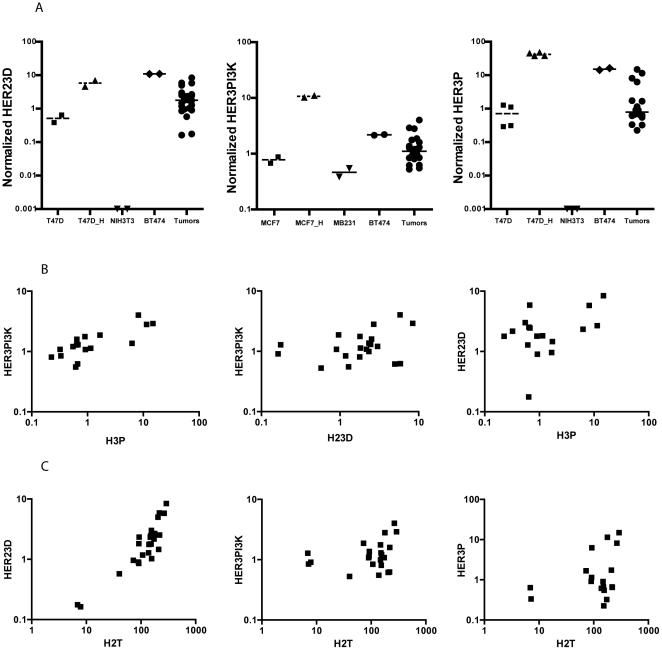
Figure 3. VeraTag assays to monitor signaling pathways in breast tumors.
FFPE sections from HER2-positive tumors were subjected to HER23D, HER3P and HER3PI3K VeraTag assays (A). Cell-line controls for each assay were used as indicated on the x-axis. Underscore H (_H) indicates cells were treated with HRG. The normalized RPA values after correction for ITC signal was plotted on the y-axis. (B) Correlations between HER23D, HER3P and HER3PI3K signal from VeraTag assays. (C) Correlations between HER2T and markers of HER3 activation (HER23D, HER3P and HER3PI3K) from VeraTag assays.

