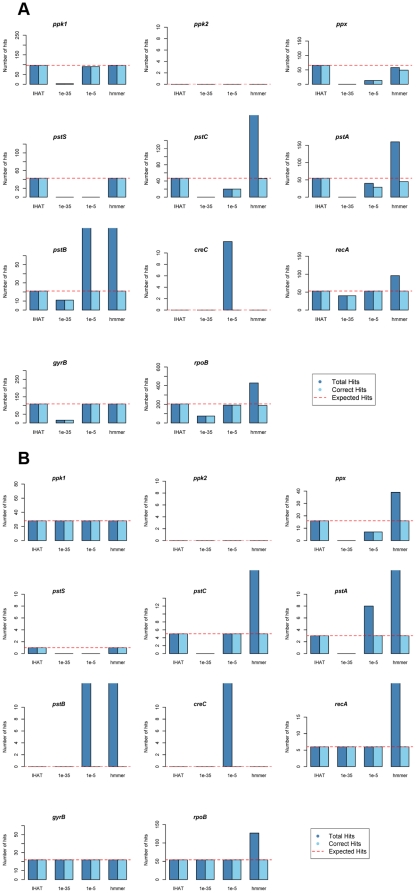
Figure 3. Bar plots of annotation success using the pipeline, TBLASTN with Ps. aeruginosa PAO1 genes at 10−35 and 10−5 expect cutoff, and HMMER3 against an artificial dataset created from HTCC7211 random (A) 350 bp and (B) 1000 bp fragments.
For HMMER3 analysis, the artificial dataset was translated into ORFs using orf_finder and then scanned using HMMER3 using the STRING-generated HMMs as the query. Light blue bars represent the number of hits that were correctly annotated. Dark blue bars represent the number of correctly annotated hits plus the number of hits to other genes. The red dotted line indicates the total number of correct hits in the dataset, equal to the number of fragments sampled within a gene locus.

