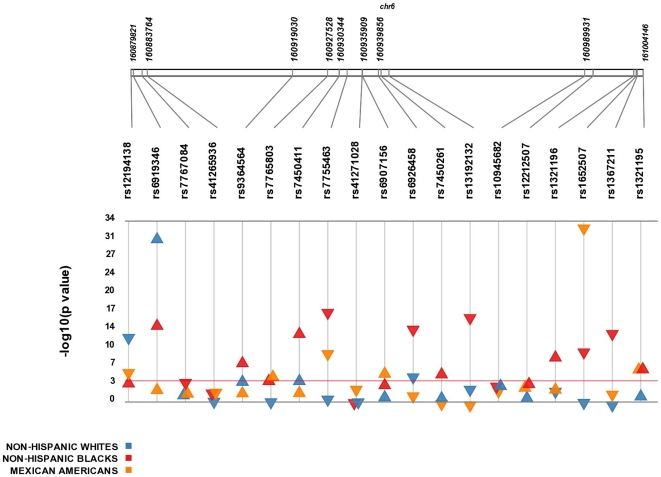
Figure 1. Overview of association results between LPA SNPs and Lp(a) levels.
Plot showing the significance of all single-SNP associations with transformed Lp(a) levels. All results are unweighted adjusted for age and sex and are stratified by race/ethnicity. SNPs are plotted on top along the x axis in order from 5′ to 3′, and association with Lp(a) is indicated on the y axis (as −log10 p-value). Red line indicates p-value of 1×10⁻⁴. Direction of the triangle indicates direction of effect (β-coefficient).

