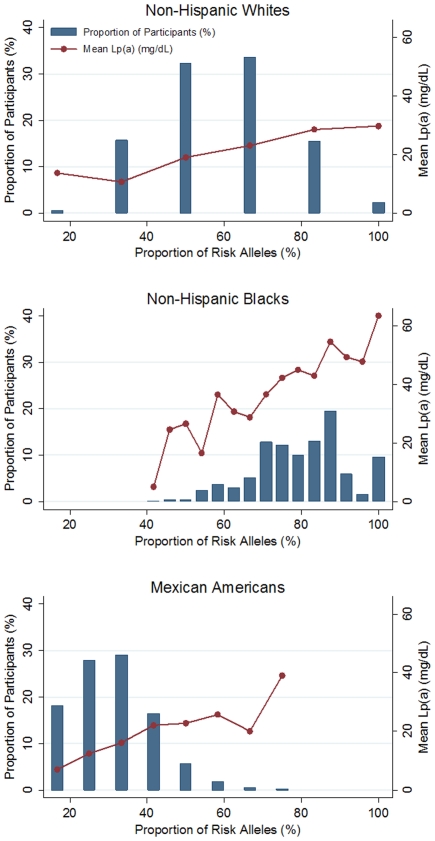
Figure 2. Distribution of LPA risk alleles in non-Hispanic whites, non-Hispanic blacks, and Mexican Americans.
Plots showing the frequency distributions of the proportion of risk alleles in the three NHANES III subpopulations. Proportion of risk alleles was calculated by dividing the total number of LPA risk alleles (i.e. the GRS, see Materials and Methods) by the total number of possible risk alleles in each population, multiplied by 100%. Mean Lp(a) values are also plotted for each corresponding proportion.

