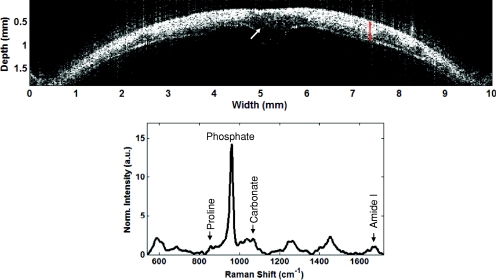
Figure 3.
RS-OCT of a dissected murine calvaria. (a) OCT image. Arrow indicates dark hyporeflective region likely associated with the suture of the left and right parietal skull plates. Red area indicates the region where the corresponding Raman spectrum was acquired. Axial scale assumes ncalvaria = 1.55.23 (b) Raman spectrum, normalized to mean spectral intensity. Arrows indicate positions of peaks typically utilized in Raman spectral analysis of mineralized tissues, including the proline peak at 857 cm−1, the phosphate peak at 960 cm−1, the carbonate peak at 1072 cm−1, the amide I peak at 1667 cm−1.

