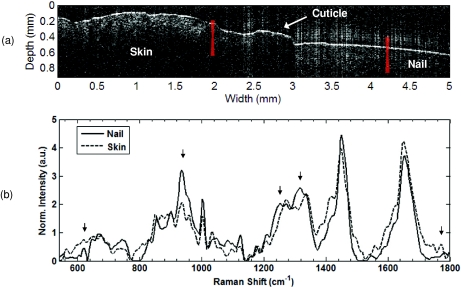
Figure 6.
RS-OCT of the region surrounding the proximal nail fold. (a) OCT image. Nail is labeled on the right side of the image, and inserts into the nail bed beneath the cuticle, which is located in the transverse dimension from 2.5 to 3.0 mm. To the left of the cuticle is the skin on the back of the finger. Raman spectra acquired from the regions are indicated from the red overlays. (b) Raman spectra of the skin and nail. Peaks of interest are indicated with arrows, and include the sharp 620-cm−1 C-S peak, the 936-cm−1 C-C protein backbone peak, the relative intensity and position of the amide III (1251 cm−1), and C-H (1317 cm−1) peaks, all of which are indicative of the β-sheet keratin proteins that make up the nail. In contrast, the 1770-cm−1 lipid peak seen in soft tissue and skin is not seen in the nail.(Color online only.)

