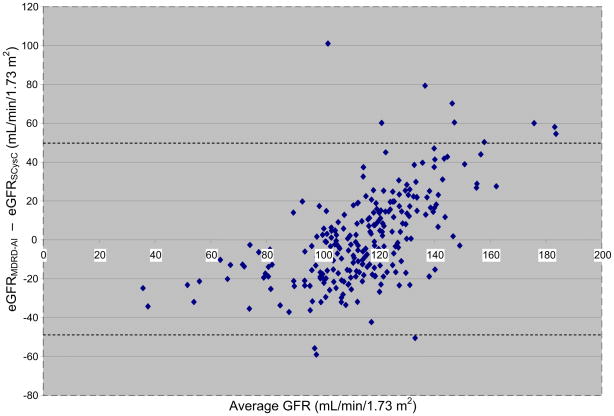
Figure 1.
Bland-Altman plot shows the difference between glomerular filtration rate estimated using the Modification of Diet and Renal Disease Study equation modified for American Indians (eGFRMDRD-AI) and serum cystatin C–based formula (eGFRSCysC) plotted against the average of the eGFRMDRD-AI and eGFRSCysC.

