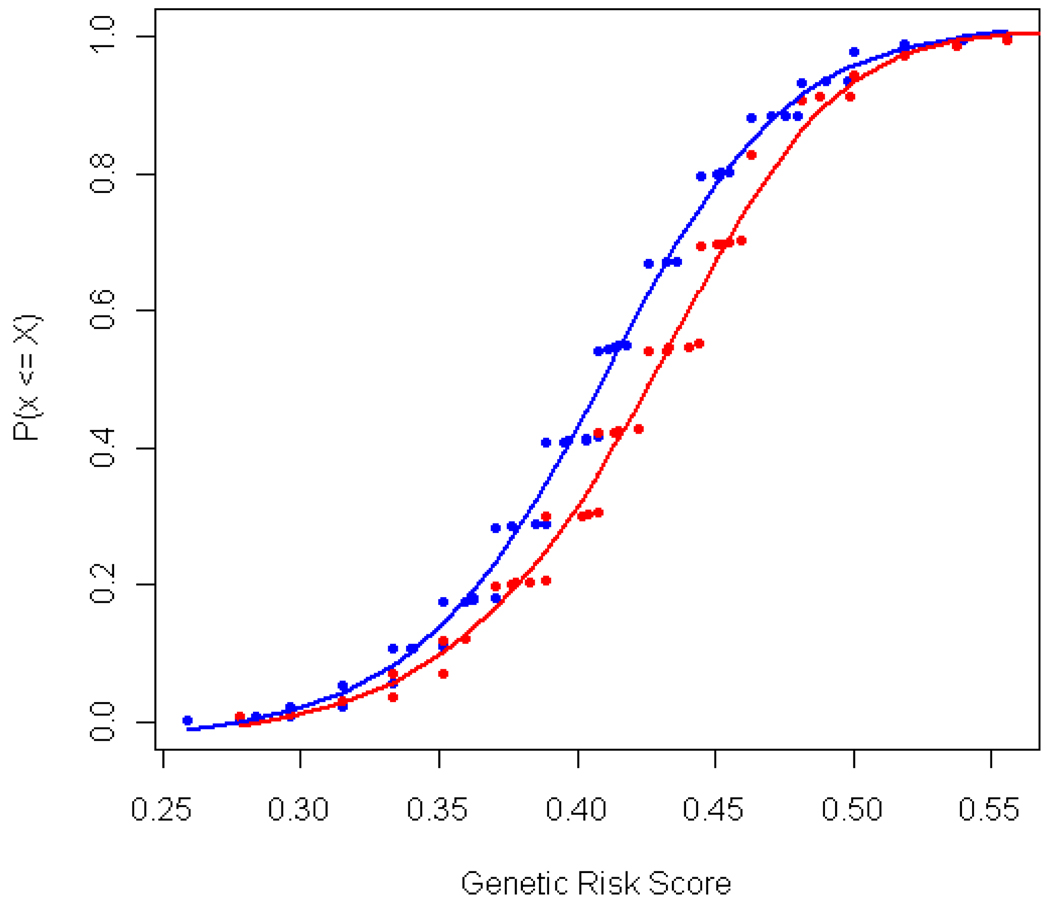
Figure 2. Cumulative distribution of the GRS scores between cases (red) and controls (blue).
The y axis, P (x <= X), is the cumulative probability that individual cases or controls have less than the given GRS score. The GRS score is defined here as the individual proportion of risk alleles carried for the 27 SNPs which have validated association with RA in populations of European ancestry. The mean is 0.43 for cases and 0.41 for controls.

