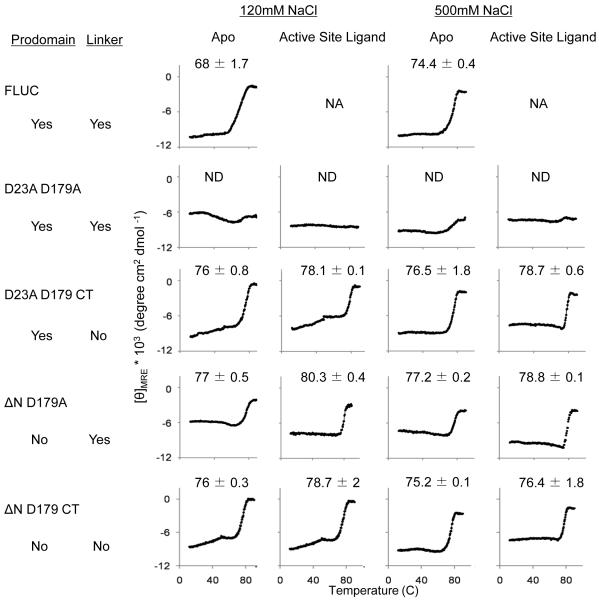
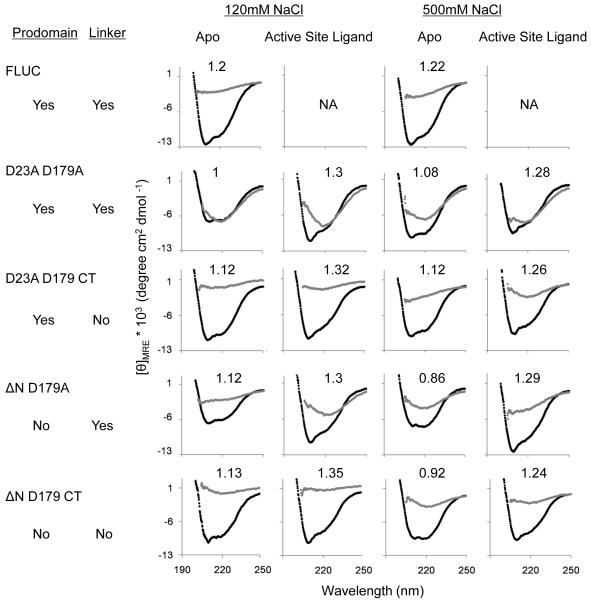
Fig. 2.
Circular dichroism (CD) of caspase-6 cleavage variants. (a) Thermal denaturation profiles of caspase-6 cleavage variants unliganded (apo) or with the active-site ligand VEID in physiological (120 mM) or high (500 mM) NaCl concentrations. The measured Tm did not vary between runs, however run-to-run variation in the shape and slope of the pre-melt transition precluded meaningful interpretation of this region of the melting curve. (b) CD spectra of caspase-6 cleavage variants at 12°C (black) or 90°C (gray). The [θ]208/[θ]222 values at 12°C are indicated above each spectra. Each variant was measured using two independently prepared and concentrated samples on two different days. The spectral features were observed in duplicate spectra and a representative spectrum for each variant is shown. NA Not applicable due to inability to functionally verify binding of VEID to the active site. ND Not Detectable.


