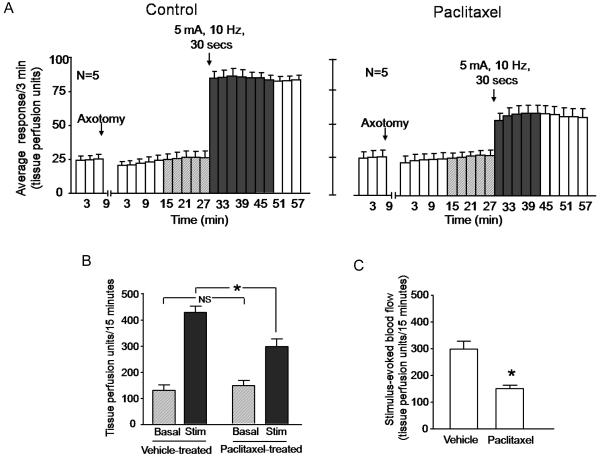
Figure 4.
Chronic administration of paclitaxel decreases electrical stimulation-induced vasodilatation in the rat hindpaw. In all cases, each column represents the mean ± SEM. A: The open columns represent the basal blood flow before or after axotomy as indicated. The hatched columns show the blood flow after the injection needle is inserted intradermally, whereas the shaded columns represent blood flow after electrical stimulation of the sciatic nerve in rats that were administered vehicle (left panel) or paclitaxel (right panel). B: Blood flow in tissue perfusion units over the 15 min prior to electrical stimulation (hatched columns) and the 15 min after electrical stimulation (shaded columns) in vehicle-treated or paclitaxel-treated animals from figure A. C: Stimulation-evoked release (stimulated release minus basal release in figure B) in vehicle- or paclitaxel-injected animals. In B and C, an asterisk indicates statistical significance between the paclitaxel treated group and the vehicle-injected group.

