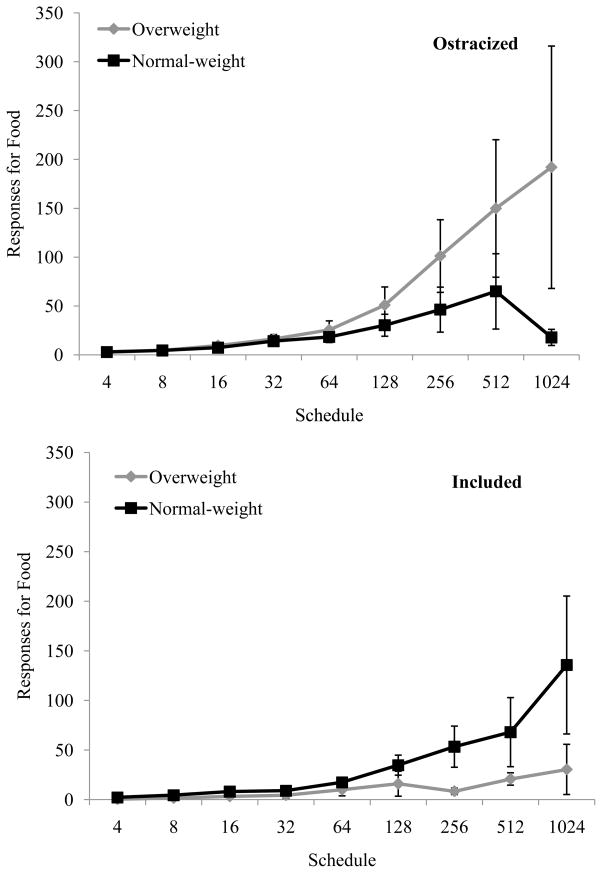
Figure 1.
Top panel: Responses for food per trial (SE) performed by overweight (n=11) and normal-weight (n= 18) participants in the ostracism condition. Overweight youth in the ostracism condition responded more for food than overweight youth in the inclusion/control condition (p < .05). Bottom Panel: Responses for food per trial (SE) performed by overweight (n = 10) and normal-weight (n = 20) participants in the inclusion/control condition. Normal-weight youth in the ostracism condition responded less for food than normal-weight youth in the inclusion/control condition (p < .001).

