Fig. 3.
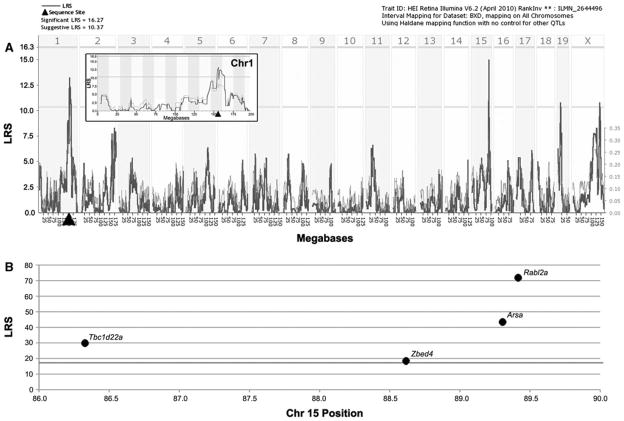
Graphic illustration of genomic regions and candidate genes that regulate Glul expression. a Two suggestive eQTLs for controlling Glul expression levels are present. The first, on Chr 1 at the position of the gene itself, is a cis-QTL. The inset is a higher magnification view of the LRS tracing on Chr 1 confirming the presence of the cis-QTL. The second eQTL is on Chr 15 centered at 88 Mb. The bold line illustrates the LRS scores across the genome. Horizontal lines mark the transcript-specific significance thresholds for significant (LRS = 16.27) and suggestive (LRS = 10.37). Filled triangle = location of Glul in the genome. b The top candidates within the trans-QTL region are illustrated by chromosomal position and LRS scores

