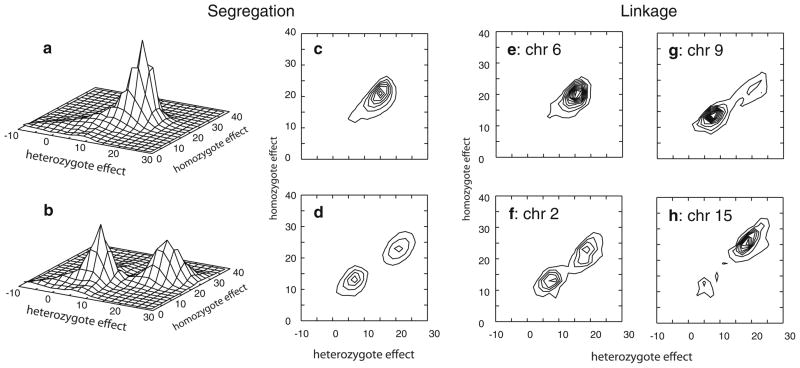
Fig. 2.
QTL models obtained in oligogenic segregation analysis (a–d), and in joint oligogenic segregation and linkage analysis (e–h). a, b Oligogenic segregation analysis with SpAvg(Adj) and SpAvg(VIQ), respectively, with scale of vertical axis denoting relative frequency of model parameters for a particular set of values for pairs of genotype effects; c, d contour plots of the same results shown in a, b; e QTL model obtained from chromosome 6 in joint segregation and linkage analysis on model SpAvg(Adj); and QTL models obtained for SpAvg(VIQ) on f chromosome 2, g chromosome 9, and h chromosome 15. Individual contour lines in all panels depict increasing relative frequency of QTL models, with individual lines incrementing at 0.75% of total QTLs in the analysis run

