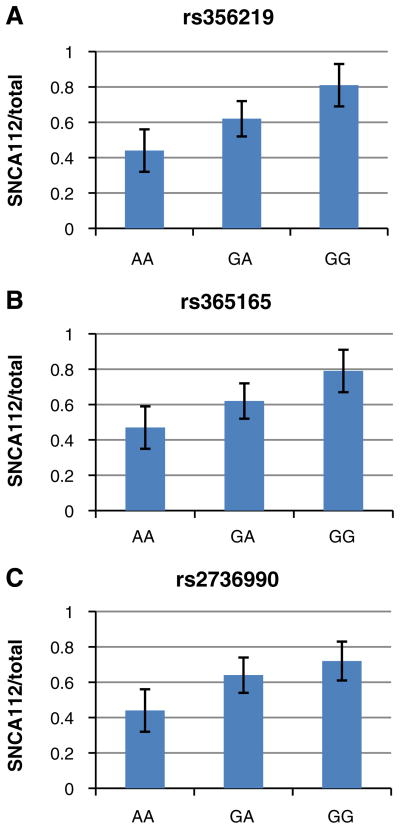
Fig. 3.
Effect of SNP genotypes at SNCA 3′ region on human SNCA112-mRNA expression levels relative to from total SNCA-mRNA levels in human frontal cortex. Individuals were genotyped for SNPs rs356219 (a), rs356165 (b), and rs2736990 (c). Fold levels of human SNCA112-mRNA in the frontal cortex were assayed by real-time RT–PCR using TaqMan technology and calculated relative the geometric mean of SYP and ENO mRNAs reference control using the 2−ΔΔCt method (i.e., results presented are relative to a specific brain RNA sample). The values presented here are mean ratios from total SNCA-mRNA levels, adjusted for age, gender, ethnicity, PMI, and source. a Analysis of rs356219 showed that the risk allele G significantly correlates in an additive manner with higher ratio of SNCA112-mRNA levels (p= 0.009). b Analysis of rs356165 showed that the risk allele G significantly correlates in an additive manner with higher ratio of SNCA112-mRNA levels (p=0.01). c Analysis of rs2736990 showed that the risk allele G significantly correlates in an additive manner with higher ratio of SNCA112-mRNA levels (p=0.03)

