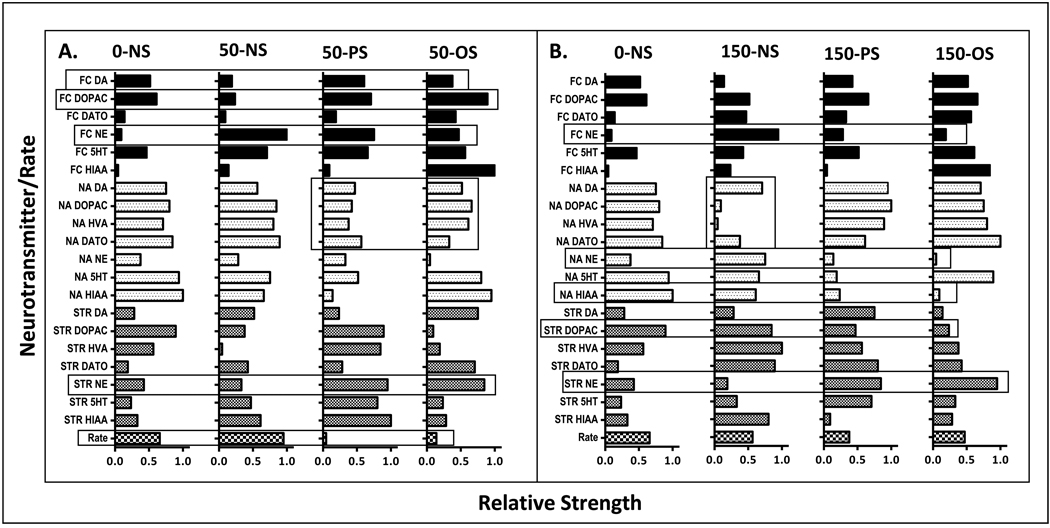
Figure 10.
Relative strengths of female offspring on a scale from 0 to 1.0 for each neurotransmitter and FI overall response rate (y axis) from session block 10 derived from principal component analyses carried out for each Pb-stress group comparing 0-NS control values to all 50 ppm group values (panel A) and 0-NS control values to all 150 ppm group values (panel B). Open bars encompassing a specific neurotransmitter show systematic changes across the groupings.

