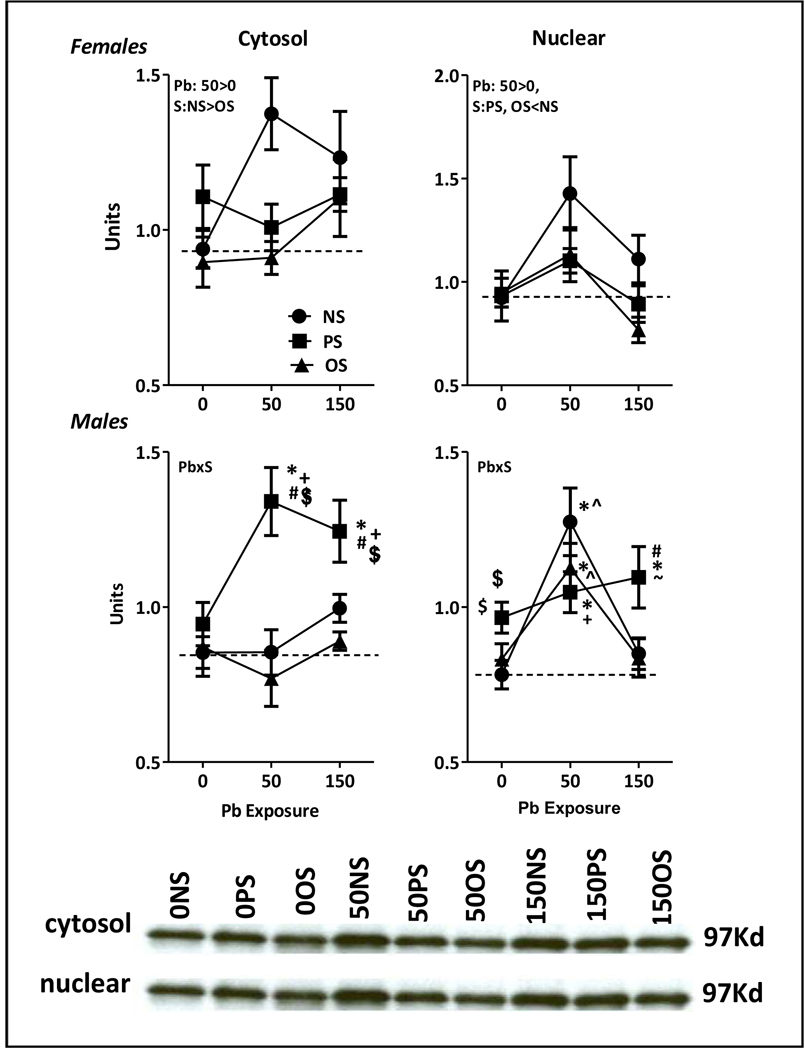
Figure 3.
Panel A. Group mean ± S.E. cytosolic (left column) and nuclear (right column) hippocampal glucocorticoid receptor density (units) in male (bottom row) and female (top row) behaviorally-tested offspring exposed to Pb, PS or OS in relation to Pb exposure level (ppm) as indicated. Dashed horizontal line depicts 0-NS control values. Pb=main effect of Pb, S=main effect of stress; PbxS= Pb by stress interaction in RMANOVA. Sample sizes: females: n=5–6; male: n=4–5. * differs from corresponding 0-NS control; # differs from 0-PS; +differs from corresponding Pb-NS group; $ differs from corresponding Pb-OS group; ^differs from 150-NS; ~ differs from 150-OS group. Panel B. Representative Western blots for female offspring for cytosolic (top row) and nuclear hippocampal (bottom row) glucocorticoid receptors at the designated 97Kd band.

