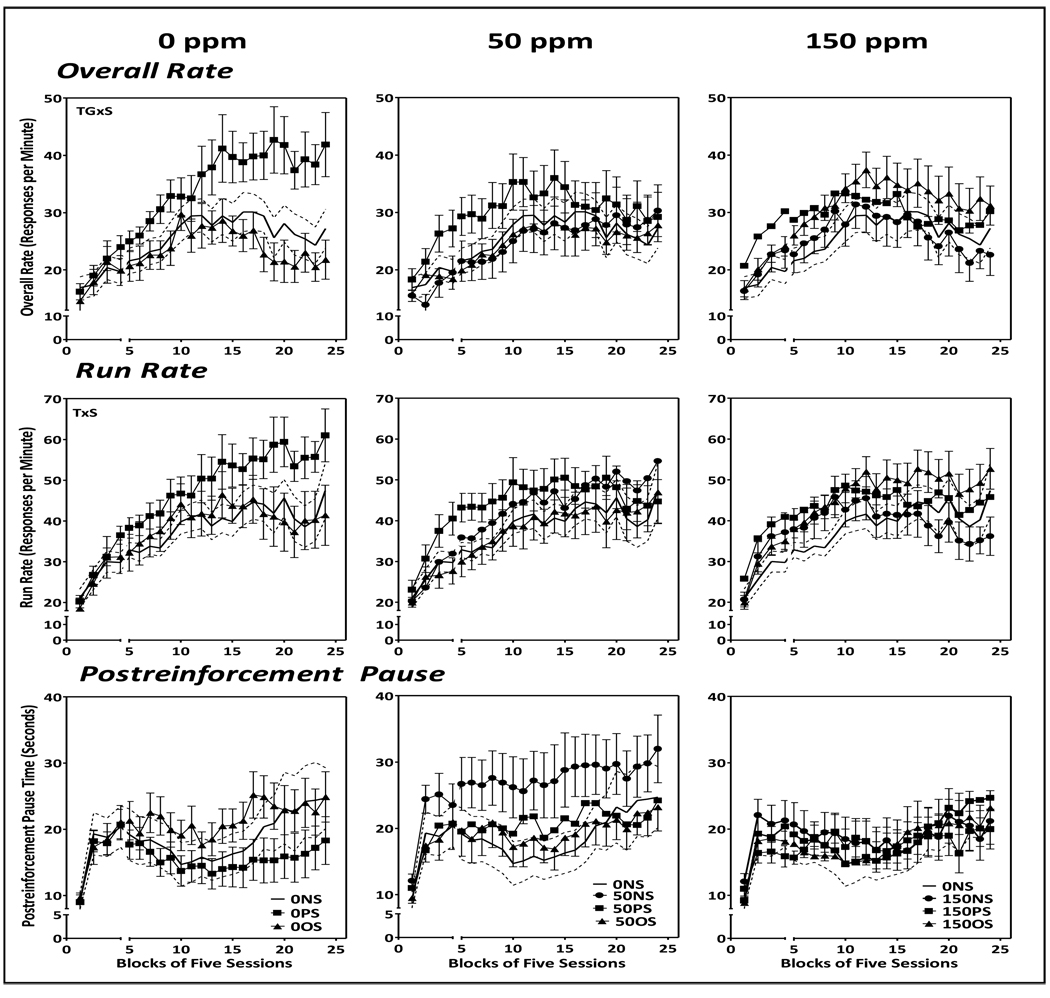
Figure 6.
Group mean ± S.E. overall response rates (top row), run rates (middle row) and postreinforcement pause time (bottom row) of male offspring exposed to 0 ppm Pb (left column), 50 ppm Pb (middle column) or 150 ppm (right column) alone or in conjunction with PS or OS across 25 blocks of 5 sessions each. Solid line flanked by dashed lines represents 0-NS group mean ± S.E. values and are depicted across all Pb exposure groups. The break in the X axis shows sessions prior to and following the imposition of stress challenges in offspring (see Methods). Sample sizes, n=9–11 per group.

