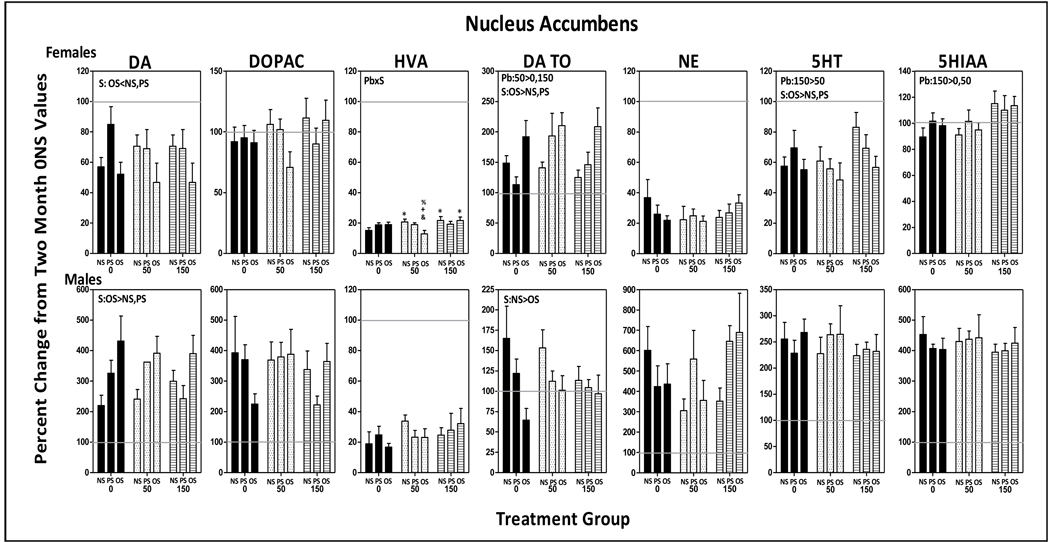
Figure 8.
Group mean ± S.E. values of nucleus accumbens levels of DA, DOPAC, HVA, DA TO, NE, 5HT and HIAA of female (top row) and male (bottom row) offspring in relation to Pb exposure and stress condition. Values are plotted as percent changes from corresponding group mean 0-NS values from littermates obtained at 2 mos of age. Solid gray horizontal lines depict the 100% of 2 mos values (no change from 2 mos of age). Sample sizes: females=6–11; males=8–11. Pb=main effect of Pb, S=main effect of stress; Pb x S = Pb by stress interaction in RMANOVAs. * differs from 0-NS control; + differs from 0-OS; @ differs from corresponding Pb-NS group; & differs from 50-OS; % differs from 150-OS.

