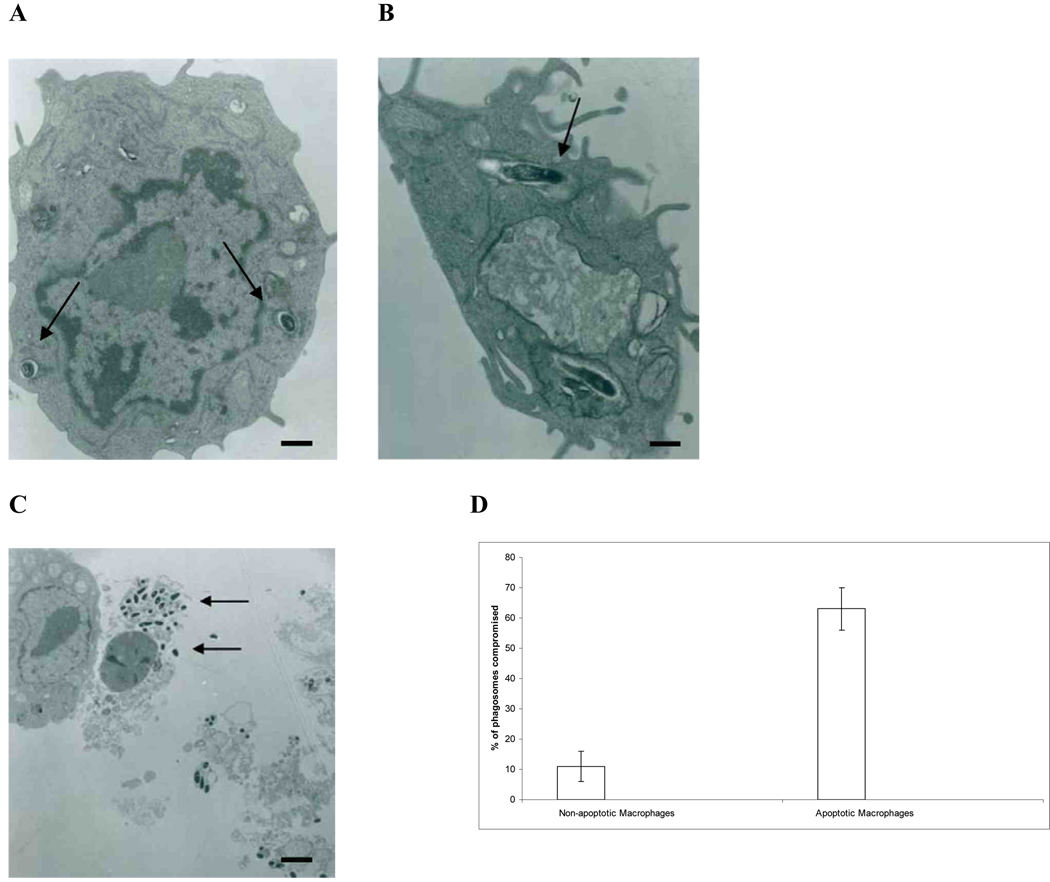
Fig. 1.
Electron microscopy images of MAC in apoptotic macrophages. (A) TEM of MAC-infected macrophages that are not apoptotic. Arrows indicate membrane bound vacuoles containing bacteria. Notice that the vacuolar membrane appears to be intact. 10,500 × magnification (bar = 5 µm). (B) TEM of MAC in an apoptotic macrophage. Arrow indicates an area where the integrity of the vacuole membrane appears to have host integrity. 12,500 × magnification (bar = 2 µm). (C) TEM of MAC-infected apoptotic macrophages being ingested by healthy macrophages (bar = 100 µm). Arrows indicate bacteria escaping the apoptotic macrophage. 2,500 × magnification. (D) Quantification of the assay based on 200 cells.

