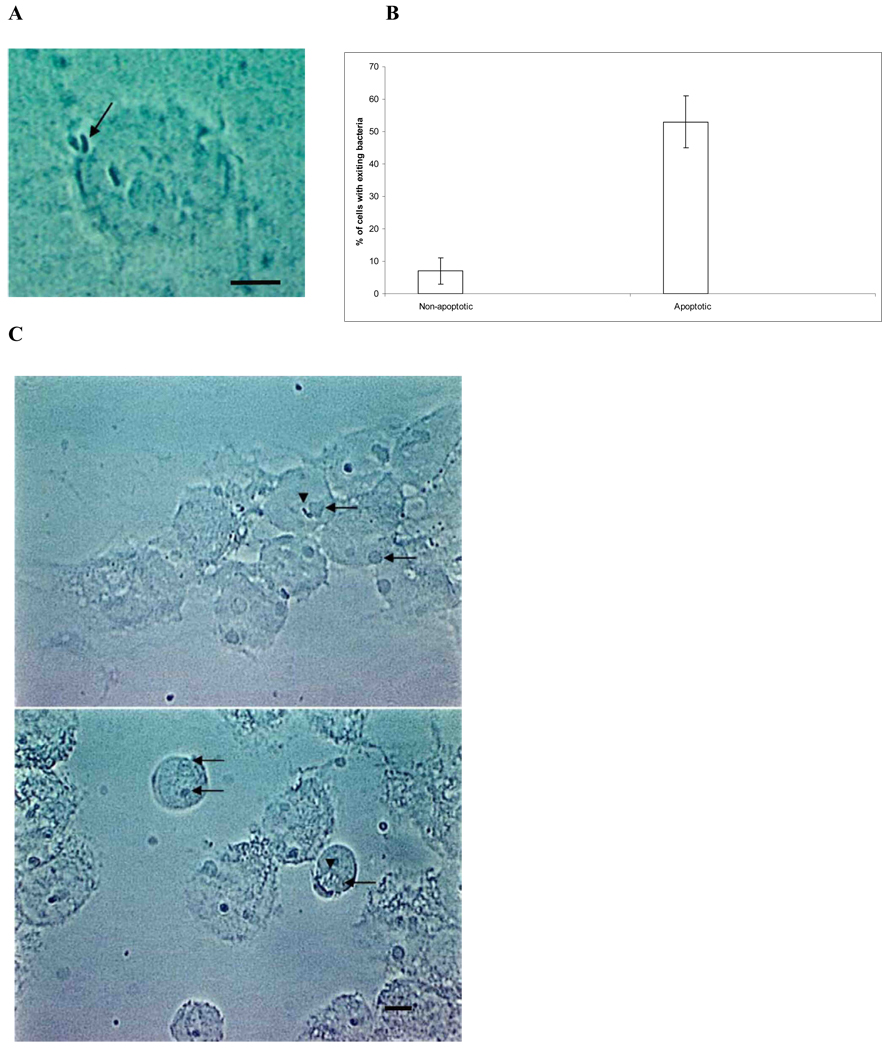
Fig. 2.
Video microscopy images of MAC in apoptotic macrophages. (A) Representative image from video microscopy, showing MAC leaving the apoptotic macrophages (arrow), while one other organism remains intracellularly (bar = 5 µm). (B) Quantification if MAC leaving apoptotic macrophages based on 200 cells. (C) Four days after the apoptotic bodies (arrows) were added to a new macrophage monolayer, MAC (arrowheads) was observed inside fresh macrophages (bar = 100 µm). A large number of apoptotic bodies are also seen, including some occupying the same vacuole with free MAC.

