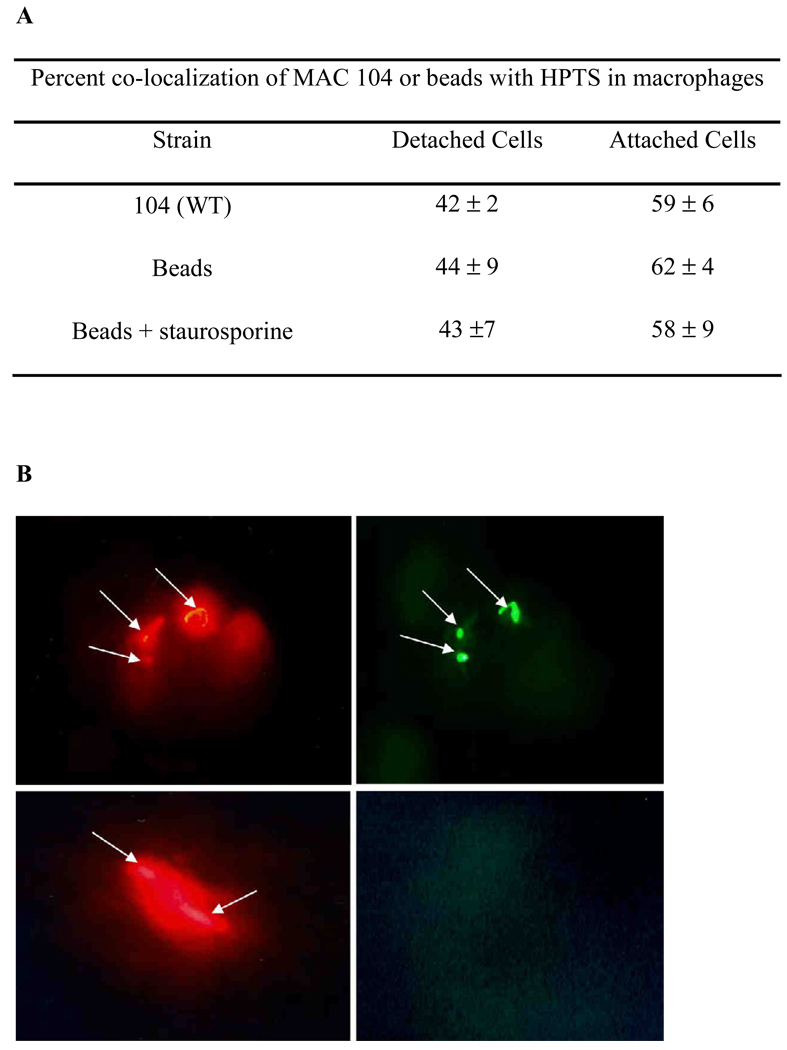
Fig. 3.
Fluorescent microscopy of MAC and HPTS in macrophages. Four days after Raw 264.7 macrophages were infected by the wild-type Texas Red-stained MAC in the presence of HPTS, attached and detached cells were, separately, collected and analyzed for co-localization on a fluorescent microscope. Values are from 3 repetitions of the assay. Examples are shown in figures: A and B show bacteria (red) and green (HPTS in the vacuole), indicating intact vacuole membrane. C & D show bacteria (red) and no vacuole (green), indicating that the vacuole is leaking.

