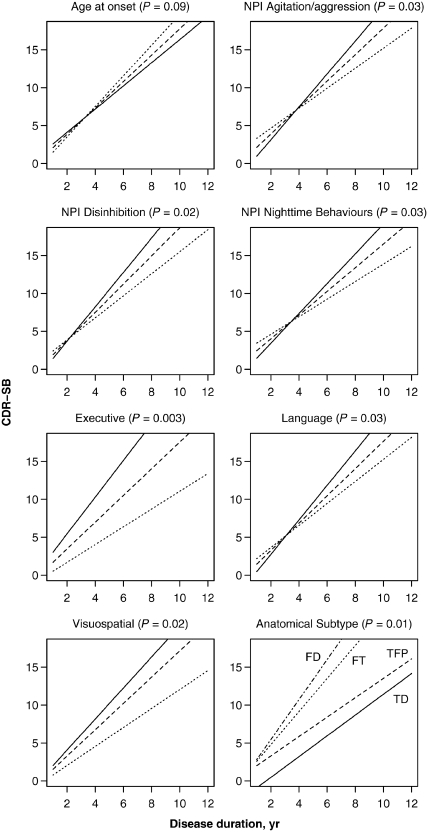
Figure 3.
The effect of significant predictor variables on the rate of CDR-SB increase. Except for the anatomical subtype predictor, the solid line represents the estimated slope for a subject having a low value (defined as the 15th percentile), the dashed line represents the estimated slope for a subject having an average value (defined as the median), while the dotted line represents the estimated slope for a subject having a high value (defined as the 85th percentile). For age at onset, 15th percentile equates to age 45, median equates to age 56 and 85th percentile equates to age 70. For anatomical subtype, the solid line represents the estimated slope for the temporal dominant (TD) group, the dashed line represents the slope for the temporofrontoparietal (TFP) subtype, the dotted line represents the slope for the frontotemporal (FT) subtype, and the dotted–dashed line represents the slope for the frontal dominant (FD) subtype. The neuropsychological composite scores are adjusted for age at baseline and education and worse performance corresponds to a lower score and steeper slope. The significance of each predictor based on a test of the significance of the interaction term between duration and the predictor is shown in parentheses in each panel title. NPI = Neuropsychiatric Inventory.

