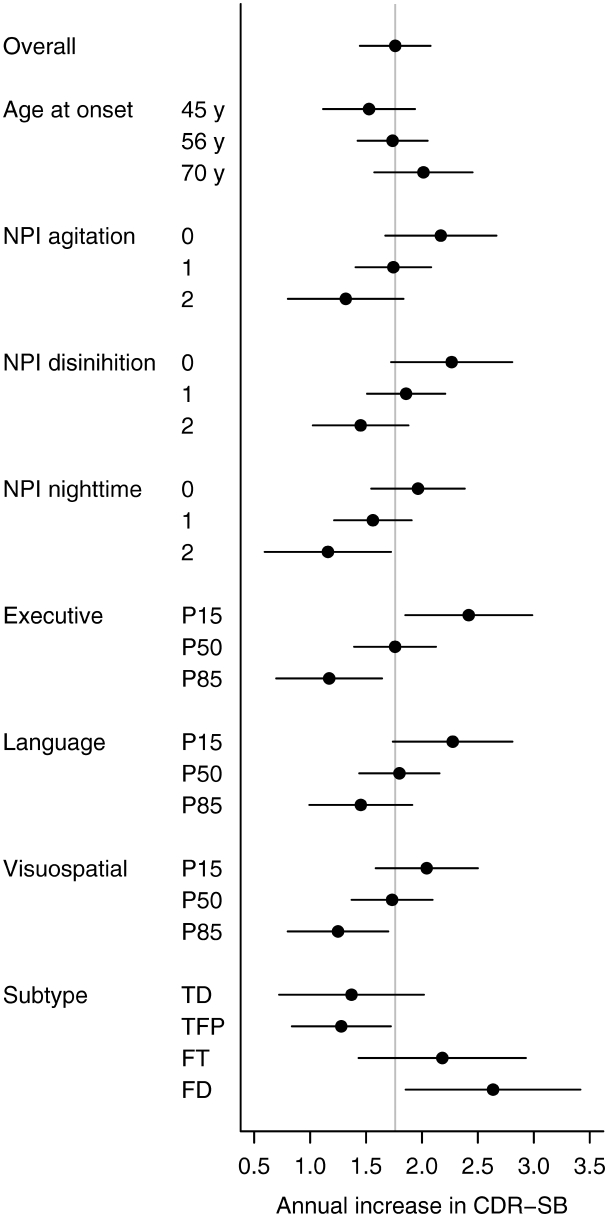
Figure 4.
The estimated annual CDR-SB increase and 95% confidence intervals by predictor compared with each other. We define ‘low’ to be the 15th percentile and ‘high’ to be the 85th percentile. The executive, language and visuospatial composite scores are adjusted for age at baseline and education and worse performance corresponds to a lower score and greater annual increase. The grey vertical line represents the overall estimated annual increase of 1.8 points per year. FD = frontal dominant subtype; FT = frontotemporal subtype; NPI = Neuropsychiatric Inventory; TD = temporal dominant subtype; TFP = temporofrontoparietal subtype.

