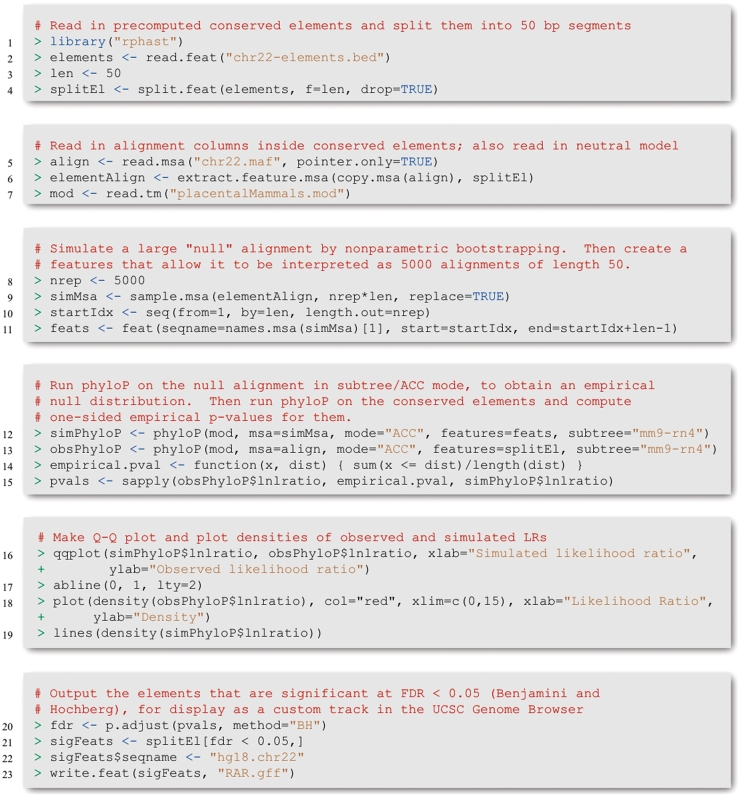
Figure 3:
Code snippets showing the use of RPHAST in vignette #2, in which ‘accelerated regions’ in the rodent (rat and mouse) genomes are identified and analyzed. The plots generated here are shown in Figure 4. The complete vignette is available at http://compgen.bscb.cornell.edu/rphast.

