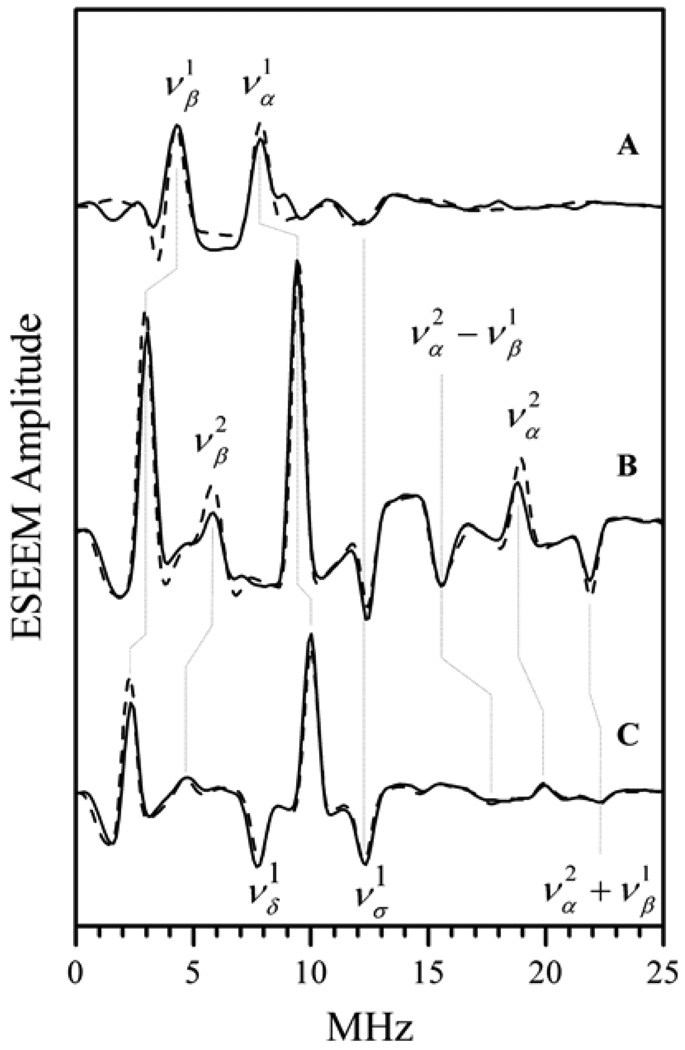
Figure 20.
Solid traces A, B, and C, cosine Fourier transforms (low-frequency part) of the primary ESEEM of [Mo17O(SPh)4]− obtained at various positions of the EPR spectrum: (A) B0 = 1040 mT, g⊥; (C) B0 = 1058.3 mT, g‖; and intermediate position (B) B0 = 1053.5 mT. Experimental conditions: mw frequency, 29.372 GHz, T = 20 K. Dashed traces show the corresponding simulated primary (2-pulse) ESEEM spectra. The simulation parameters were as follows: nucleus, 17O; isotropic hfi constant, aiso = 6.5 MHz; axial anisotropic hfi tensor with T⊥ = 1.6 MHz; axial nqi tensor with the quadrupole coupling constant (e2Qq/h) = 1.45 MHz. The axes of the hfi, nqi, and g-tensors were coincident. The assignments of the clearly visible lines are indicated. Reprinted from [57].

