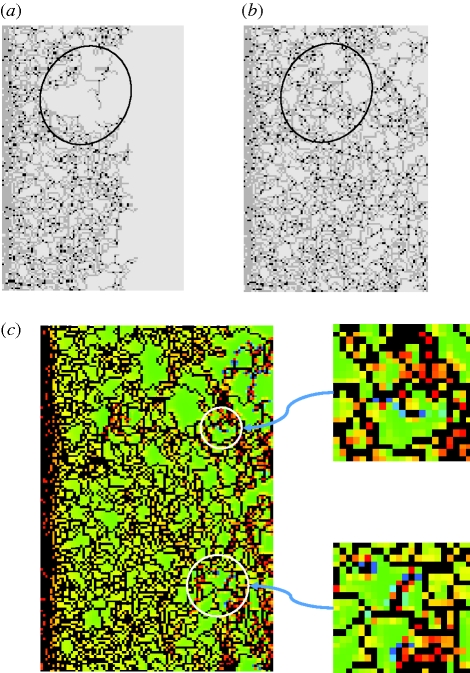
Figure 11.
A simulation initiated from a band of invaders at left (similar to figure 4) with βnr = 0.035 and c1 = 0.3 shows backfilling between (a) time step 100 and (b) time step 150 in the encircled area. (c) The distribution of the strain measure ɛ1 = ɛy + ɛz after 150 time increments shows that backfilling is likely to continue into already-closed voids in other areas (encircled in white). Scale in (c) is the same as in figure 4c.

