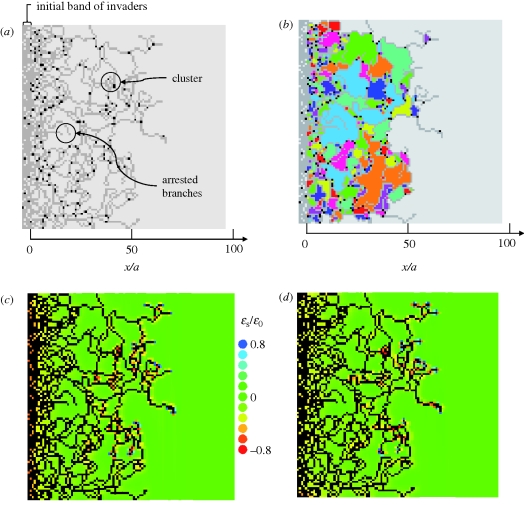
Figure 4.
A network grown from an initial band of invaders for parameter values β = 0.04, nr = 1, p = 1, c1 = 0.3. (a) Branches of invader cells (grey) are punctuated by occasional bifurcation or sprout points (black). Permanently arrested branches and clusters of invaders occur occasionally. (b) Colour coding highlights distinct void areas between branches (the simple algorithm for colour choice does not forbid neighbouring voids from having the same colour). (c,d) Strain measures ɛs = ɛy + ɛz and ɛs = ɛz + ɛx, respectively, normalized by ɛ0. The colour assigned to each computational element refers to the value of the plotted quantity next to the face of the element through which invasion is most favoured (the face for which the value of the strain-cue factor, Sij, of equation (2.3a) is maximum). In (c,d), all invaded elements are black.

