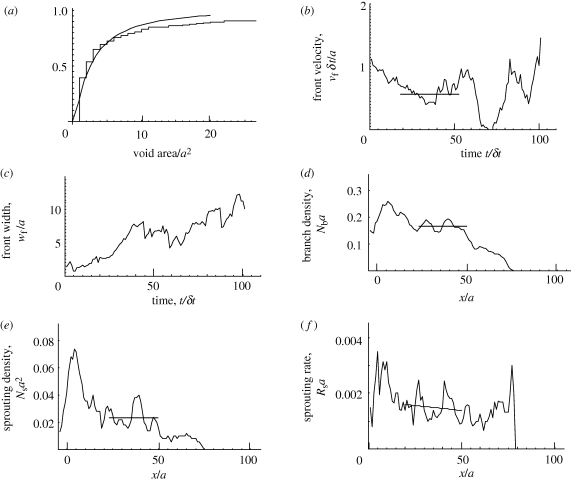
Figure 5.
Some statistics of the simulation shown in figure 4. (a) Distribution of void areas. (b,c) The velocity and the width of the front, respectively, versus time. The velocity is a moving average over 11 time increments. (d) The average density of branches per unit length normalized by the element width along a line of constant x (moving average over five values of x). (e) The density of sprouts per unit area normalized by the element area along a line of constant x (moving average over five values of x). Mean values over intervals of uniform network characteristics are indicated by horizontal lines in (b), (d) and (e). (f) Rate of sprouting per length of advance of a branch in the x-direction normalized by a. Smoothed trend over interval following transient (x > 25) shown by fitted line.

