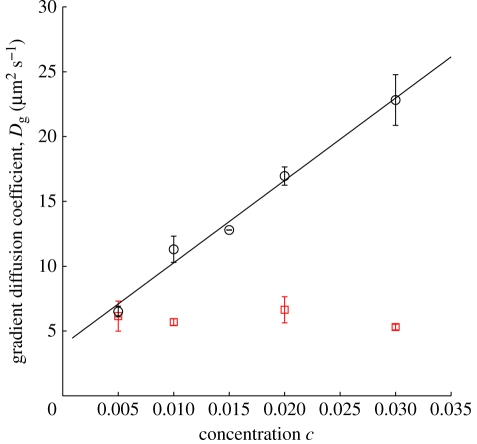
Figure 2.
Gradient diffusion coefficient Dg from PER experiments with lipopolymer DSPE-PEG2k-CF (circles) and a control DOPE-NBD (squares) in glass-supported DOPC. The solid line is a least-squares fit of equation (3.1) to the lipopolymer data, furnishing D0 ≈ 3.7 µm2 s−1 and β ≈ 180 (see text for details). Error bars are the standard deviation of at least three PER measurements at each tracer concentration.

