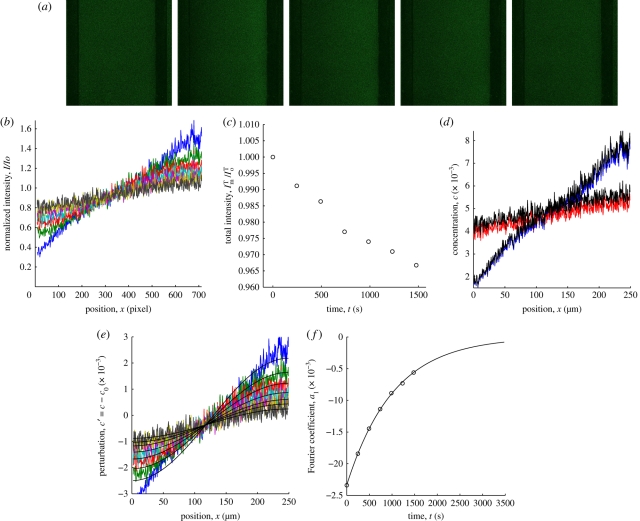
Figure 4.
A representative PER experiment and analysis to obtain the gradient diffusion coefficient at the average lipopolymer concentration. (a) Fluorescence images of DSPE-PEG2k-CF in a DOPC bilayer with lipopolymer mole fraction c0 = 0.005 before electrophoresis (left) and during PER: t = 0, 246, 493, and 1478 s (left to right). Scale bar, 100 µm. (b) Intensity profiles normalized with the pre-electrophoresis intensity profile. (c) Total intensity ImT scaled with the total intensity I0T at time t = 0. Circles correspond with the time series in panel (b). (d) Concentration profiles with (black) and without correction for acquisition photobleaching. For clarity, only the first (t = 0) and last series (t = 1478 s) in panel (b) are shown. (e) Concentration profiles with correction for acquisition photobleaching, and the accompanying first-Fourier mode (black lines). Colours correspond with the time series in panel (b). (f) Amplitude of the first-Fourier mode a1(t) (circles) and the least-squares exponential fit (solid line) giving τ1 ≈ 1043 s and Dg ≈ 5.73 µm2 s−1.

