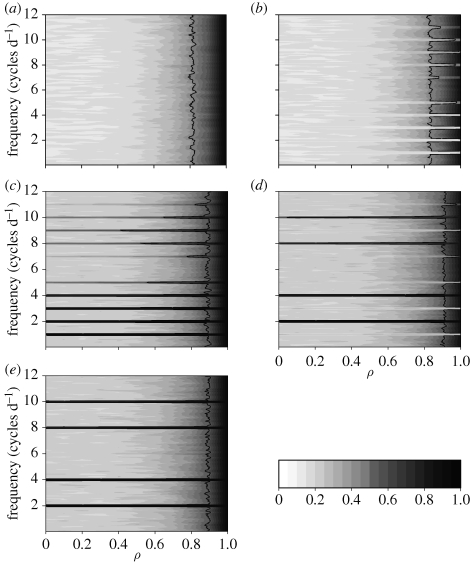
Figure 2.
Contours of averaged-squared coherence values of 100 pairs of simulated trajectories based on equation (3.1) sampled at hourly intervals, presented for different combinations of circadian oscillations in activity and strengths in stochastic correlation ρ. All panels have the same colour-value map, shown at the bottom right, with white corresponding to squared coherency values of 0 and black to values of 1. Each panel represents the pair of circadian patterns used (§3): (a) deterministic type 0,0; (b) deterministic type 0,1; (c) deterministic type 1,1; (d) deterministic type 1,2; (e) deterministic type 2,2. For all figure panels, the common range of ρ values is shown below (e); the y-axis shows the frequency of step-length co-oscillation. The line is contoured at the level corresponding to the asymptotic 95th percentile for the null hypothesis that the squared coherency is absent (i.e. is 0 for all ω). To restrict the different types of stochasticity so that the value of ρ = 1 corresponds to identical time-series values in the SN, we set τmin = τmax = 0. Electronic supplementary material, appendix A, figure S1, shows similar results for shorter sampling intervals.

