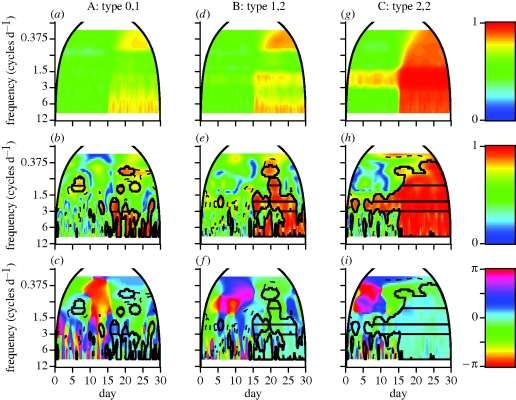
Figure 3.
Wavelet analyses of simulated movement trajectories provide estimates of the modulus and phase differences with colour-value maps on the right. The column title of each panel column, labelled A, B and C, denotes the pair of circadian patterns used with τmin = τmax = 30 min (§3). (a,d,g) Averaged squared cross-wavelet modulus values for 100 pairs of simulations. (b,e,h) Representative squared wavelet coherence values of a single pair of step-length values driven by the deterministic movement types identified in the column label; (c,f,i) the corresponding phase differences. For each simulation, the correlation ρ across individuals in the stochastic component of incremental movement changed from 0.05 to 0.95 on day 15. Solid arched lines denote the cone-of-influence, outside of which wavelet calculations are unreliable owing to the finiteness of the data. Dashed lines are drawn at the 0.95 quantile values using a white noise null model and indicate significant co-oscillation according to the ‘pointwise’ test. Solid lines within the dashed lines indicate values that are ‘areawise’ significant. Horizontal lines within the solid lines indicate significant patches that are longer than 95% of the coherent regions defined as ‘areawise’ significant, obtained from 100 wavelet-based surrogate datasets.

