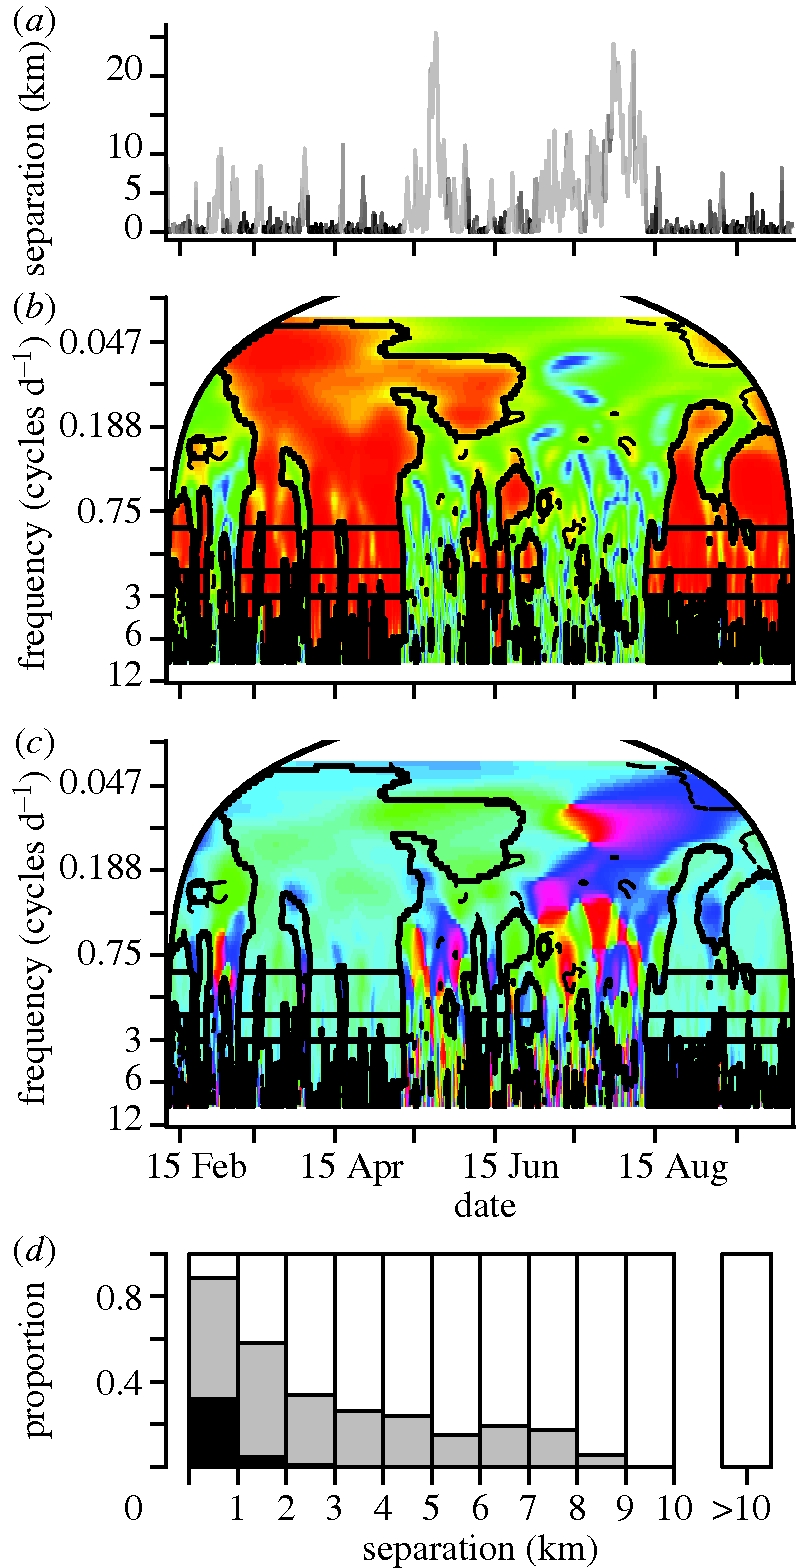
Figure 4.

The extended family elephant pair of Monsoon and Stratus demonstrates classic fission–fusion behaviour over time, shown in (a) by the inter-individual distances calculated across a period of coordinated tracking; the line is coloured to indicate the proportion of frequencies ≥1 cycle d−1 at each time step that are significant compared with random walk-type movement, where light grey = 0 and black = 1. Wavelet analysis squared coherence (b) and phase difference (c) values with associated colour maps and the inset lines outlining significant regions as defined in figure 3. (d) A bar plot of the proportion of movement synchrony classifications for different separation distance bins: black denotes strong synchrony, defined by times where ≥80% of wavelet coherence values for frequencies ≥1 cycle d−1 are significant and phase differences are ≤π/8; grey denotes intermediate synchrony, defined by times with significant wavelet coherence at any of the frequency values 1, 2 or 3 cycles d−1 (corresponding to detectable circadian movement patterns of individuals), regardless of the phase difference but without strong synchrony also being present; and white denotes no synchrony, defined by times with no significant co-oscillations at 1, 2 or 3 cycles d−1. Strong synchrony occurs during times of extended pair bonding and relatively close spatial proximity and is associated with high correlation between values of the additional movement data (step lengths, turning angles and absolute direction heading—figure 5). Intermediate synchrony occurs across the range of close to intermediate spatial separation values, with less correlation in the additional movement data. No synchrony is present for maximal separation values but can occur even for very close separation values, and is associated with no correlation in movement data. Fission–fusion transitions in the bonding between the two elephants are clearly delineated by the wavelet analysis.
