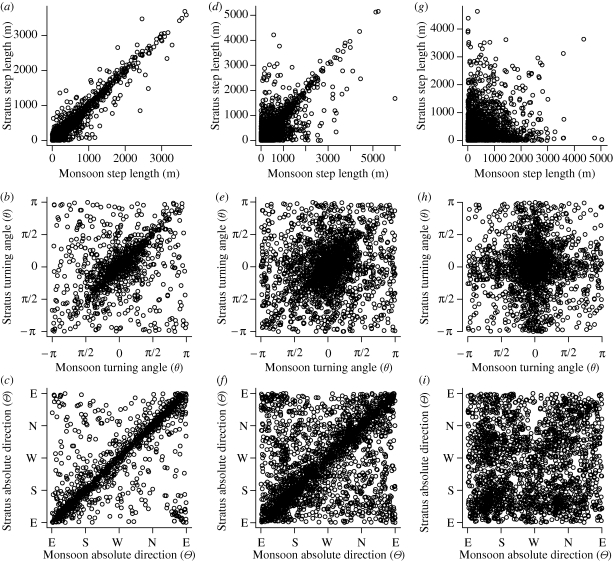
Figure 5.
Based on the wavelet coherence analysis of Monsoon and Stratus (figure 4), data were partitioned into times of strong synchrony (a–c), intermediate synchrony (d–f) and no synchrony (g–i), as defined in figure 4. Plotting step length (a,d,g), turning angle (b,e,h) and absolute direction (c,f,i) values given these partitions confirms that wavelet-based step-length analyses isolate different types of group cohesion. For step length, the squared sample correlation coefficient (R2) and significance (p) between the two variables, and for angle plots the circular version of Pearson's product moment correlation (r) and significance values (p), are as follows: (a) R2 = 0.91, p = 0; (b) r = 0.46, p = 0; (c) r = 0.74, p = 0; (d) R2 = 0.53, p = 0; (e) r = 0.22, p = 0; (f) r = 0.50, p = 0; (g) R2 = 0.02, p = 0; (h) r = 0.04, p = 0; (i) r = 0.09, p = 0. Absolute direction axes are labelled W, west (0 rad); S, south (−π/2 rad); E, east (π rad); N, north (π/2 rad).

