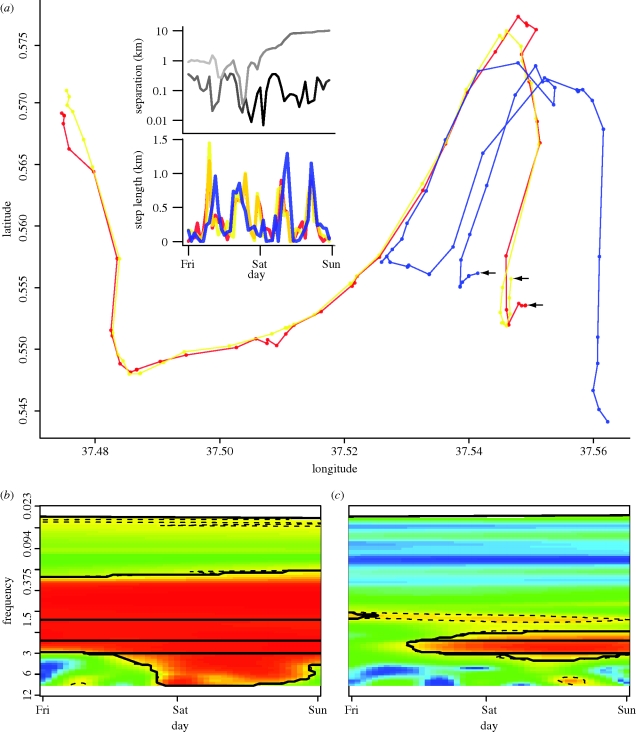
Figure 6.
A moment when the three individuals Monsoon, Stratus and Goya converge in space–time shows differences in movement coordination irrespective of separation distance. (a) The spatial trajectories of Monsoon, Stratus and Goya represented by the colours red, yellow and blue, respectively; the black arrows point to the starting position of this sequence of moves for each individual. The top panel of the two inset figures shows separation distances on a log10 scale between individuals of each pair, with the top line corresponding to the Monsoon–Goya pair, and the bottom line corresponding to the Monsoon–Stratus pair; the line is coloured to indicate the degree of coherence as described in figure 4. The bottom panel of the two inset figures shows step-length values, where the colours are as in the spatial trajectories, and the colour orange shows high overlap between Monsoon (red) and Stratus (yellow). (b,c) Colour contour plots of squared wavelet coherence between the two pairs, where the colour values and significance lines are as in figure 3: (b) Monsoon–Stratus (extended family); (c) Monsoon–Goya (unaffiliated). Coherence analyses for the remaining pairwise combinations are reported in the electronic supplementary material, appendix B, figure S2.

