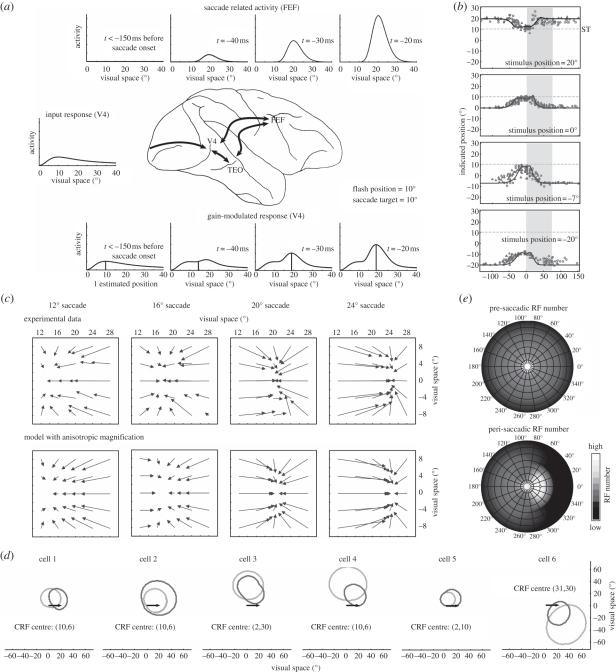
Figure 3.
The spatial re-entry model for anticipatory saccade target processing [70]. The figure illustrates the impact of oculomotor feedback on neural populations, receptive fields and perceptual localization. (a) Population activity along the horizontal meridian of the input (middle) and the gain (bottom) stage are shown together with the feedback signal (top) in visual space. The saccade target is located at 20°. A stimulus is flashed at 10°. Long before saccade onset (t < −150 ms), the oculomotor feedback is inactive and thus, the population responses in the input and the gain stage are identical. The stimulus is seen at its true position. At t = −40 ms, the oculomotor feedback is sufficiently strong to distort the population response. The stimulus, as decoded from the population activity, is already shifted towards the saccade target. As the presentation time of the stimulus gets closer to saccade onset, the feedback signal, and thus the gain factor, increases further and the decoded stimulus position moves even closer to the saccade target. (b) Time course of compression obtained for four flash positions during a 20° saccade. Experimental data from Morrone et al. [15] is shown together with the model predictions (solid lines). The grey shaded area denotes the duration of the saccade. (c) Two-dimensional spatial pattern of compression as obtained for four saccade amplitudes. The top row shows the experimental data replotted from Kaiser & Lappe [21]. The bottom row shows the predictions of the model. (d) Examples of six model receptive fields for a fixation and a peri-saccadic epoch. In the fixation epoch, the current receptive field (CRF) was measured without the impact of oculomotor feedback. In the peri-saccadic epoch, receptive fields were measured immediately before saccade onset when the feedback signal is strongest. While cells 3, 4 and 6 show a peri-saccadic change reminiscent of V4 receptive field dynamics, i.e. shift and shrinkage towards the saccade target (arrows), cells 1, 2 and 5 show a pattern that is also consistent with the typical findings of predictive remapping, i.e. a shift or enlargement parallel to the saccade vector. (e) Effect of peri-saccadic receptive field changes on visual sampling density for a 20° saccade. At the top, the pre-saccadic number of receptive fields as measured in the fixation epoch are shown as a function of position in visual space. At the bottom, the peri-saccadic number of receptive fields as measured immediately before saccade onset is shown. The number of responsive cells increases in the saccade target region.

