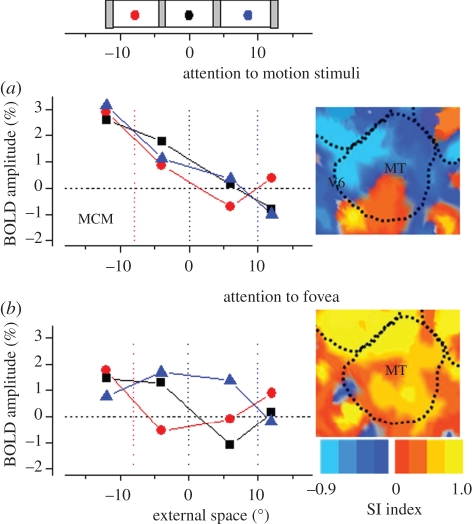
Figure 2.
BOLD response amplitudes for area MT for one hemisphere of an example subject as a function of the spatiotopic stimulus coordinates (0 is screen centre), during (a) passive fixation and (b) the high-load attentional task. The responses are colour-coded by fixation (red −8°, black 0°, blue +8°: fixation indicated by the dotted coloured lines). In the passive viewing the responses at all three fixations line up well, consistent with spatiotopic selectivity; with foveal attention they are clearly displaced in the direction of gaze, and become retinotopic. The inserts at right show by colour-code how the ‘spatiotopicity index’ of voxels in the region is dependent on attention. During passive fixation, most of MT is blue (spatiotopic), but when the subject performed the attention-demanding foveal task these voxels became strongly retinotopic (red/yellow code). The index was similar to that used by Gardner et al. [31]. It is the difference of the squared residuals differences in response amplitude for the three fixation conditions when they are in a spatiotopic alignment (residS) and retinotopic alignment (residR), normalized by the sum of the squared residuals  .The index is constrained between −1 (full spatiotopicity) and +1 (full retinotopicity).

