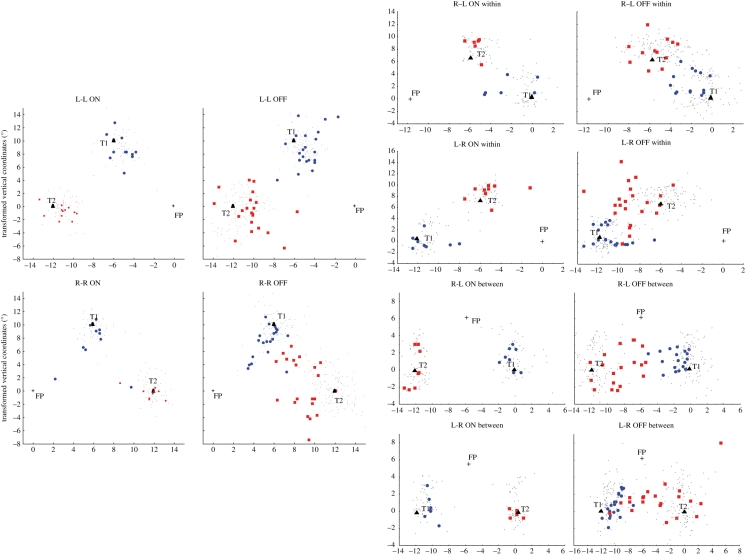
Figure 8.
Plot of final eye positions for saccades 1 and 2 in patient OK and controls, separately for R-R, L-L, within-hemifield and between-hemifield L-R and R-L conditions, in ON and OFF trials. Horizontal and vertical coordinates have been transformed to present the data on the same triangle of target locations. Grey dots, control; blue circles, saccade 1 OK; red squares, saccade 2 OK.

