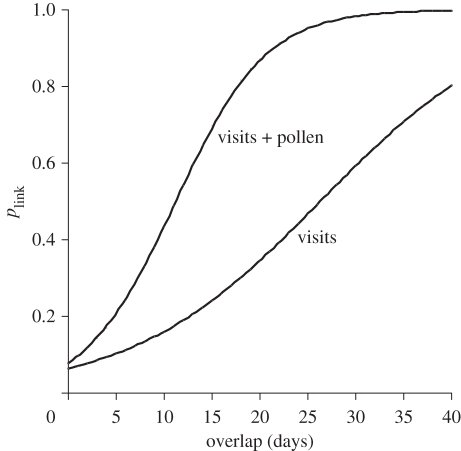
Figure 2.
Increase in probability p of observing a link with increasing phenophase overlap between a species pair in the pollination network. p is the fraction of species pairs with similar overlap in which a link is observed. Curves represent logistic regression models: visit data (y = exp(−2.68 + 0.102x)/(1 + exp(−2.687 + 0.102x)), Akaike information criterion = 237***; visit and pollen data (y = exp(−2.456 + 0.219x)/(1 + exp(−2.456 + 0.219x)), Akaike information criterion = 226***.

