Figure 1.
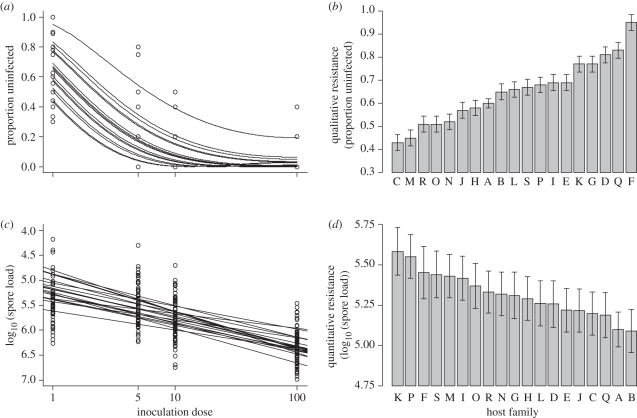
Monarch resistance to O. elektroscirrha. (a) Effect of inoculation dose on the proportion of monarchs that remained uninfected for each monarch family line. Note that the lines shown represent least-squares regression lines for monarch families on the basis of arcsine-square-root-transformed proportions; intercepts, but not slopes, are significantly different on the basis of logistic regression (see §3). (b) Variation in qualitative resistance (expressed as the intercept ± s.e. of the regression lines in (a)) observed among the 19 host families, ranked from least to most qualitatively resistant. (c) Effect of inoculation dose on parasite spore load in animals that became infected for each monarch family. Note that the y-axis is inverted because lower parasite spore load indicates higher quantitative resistance. Lines represent regression lines fitted for each monarch family: intercepts, but not slopes, vary significantly among families. (d) Variation in quantitative resistance (expressed as the intercept ± s.e. of regression lines in (c)) observed among the 19 host families, ranked from least to most quantitatively resistant.

