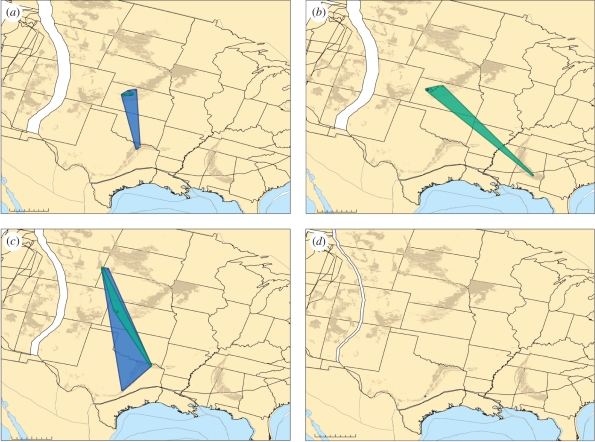
Figure 3.
PaleoGIS [53] range reconstructions illustrating the palaeobiogeographic patterns uncovered for the majority of two-taxon comparisons in this study. Tylosaurus sp. (blue) and Platecarpus sp. (dark green) distributions are shown during the Late Cretaceous. Late Cretaceous stages: (a) Coniacian, (b) Santonian, (c) Campanian, (d) Maastrichtian. These taxa do not show a statistically significant negative range area correlation through time and thus are not identified as CCRs. Present day outcrop of Late Cretaceous sediments is also shown (brown). Scale bars, (a–d) = 0–500 km.

