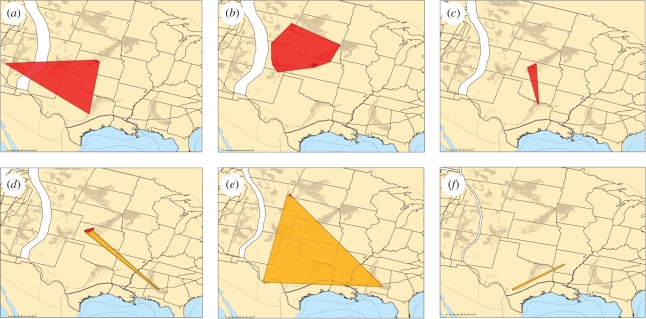
Figure 4.
PaleoGIS [53] range reconstructions illustrating the general predicted geographical pattern of a CCR, although the negative relationship in range size is not statistically significant. Squalicorax falcatus (red), and S. kaupi (orange) distributions are shown during the Late Cretaceous. Late Cretaceous stages: (a) Cenomanian, (b) Turonian, (c) Coniacian, (d) Santonian, (e) Campanian and (f) Maastrichtian. Squalicorax falcatus shows stable, though dynamic, range size until the origination of S. kaupi in the Coniacian (c). After this time, S. falcatus experiences sequential decrease in range size resulting in extinction at the end Campanian (e). This example illustrates a negative relationship between the range area of two ecologically similar species within the same genus, and thus could represent a competitive replacement of S. falcatus by S. kaupi. Present day outcrop of Late Cretaceous sediments is also shown (brown). Scale bars, (a–f) = 0–500 km.

